Easy IoT
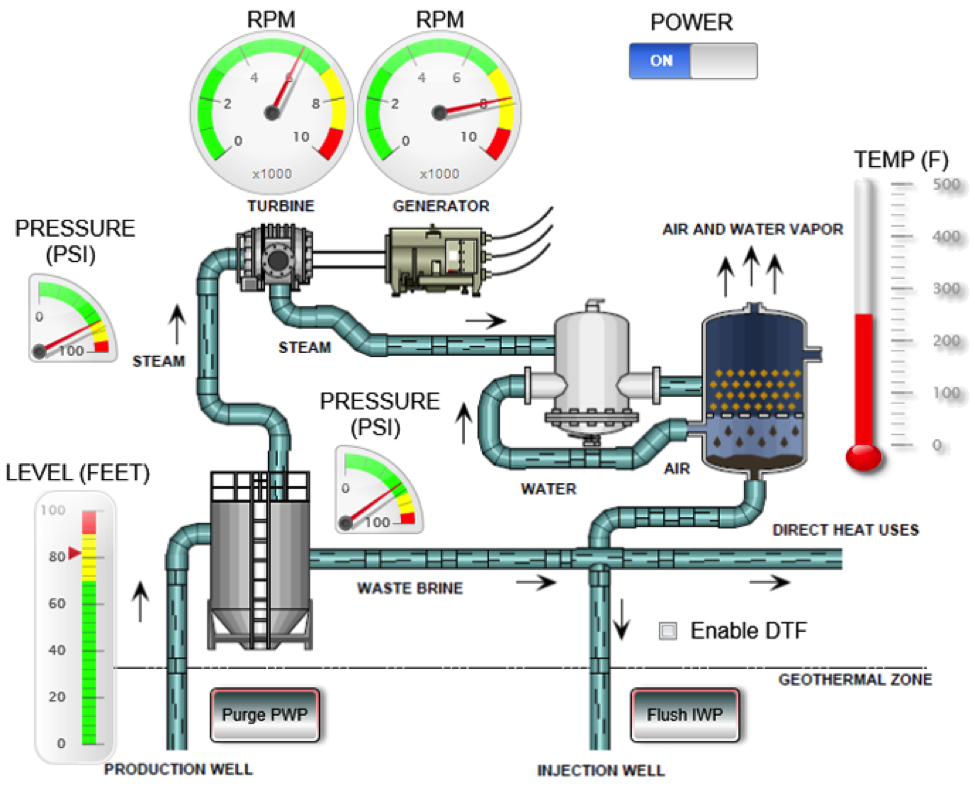
uC/Probe is a PC program by Micrium Inc. that is designed as a visual debugging aid for embedded systems. uC/Probe allows easy monitoring and control of a target MCU via a ‘Dashboard’ comprised of visual objects (such as a dial, line chart, slider, etc.) that are mapped to application program variables.

uC/Probe can communicate with the target MCU using a variety of physical connections such as a JTAG debugger, UART, Ethernet or Wi-Fi. Whatever the physical connection, the protocol is the same; uC/Probe simply issues commands to the target to read and write MCU memory locations.
Constructing a ‘Dashboard’ screen is simple. The first step is to load the target program’s symbol table (ex: ELF file) into the uC/Probe ‘Symbol Browser’ so uC/Probe knows the physical memory address for each target variable. Next the desired visual objects are dragged from the ‘Toolbox’ and positioned and sized on the Dashboard screen. Visual objects can be further configured with attributes, such as colors, range, scaling, etc. Finally each visual object on the Dashboard is mapped to a specific target program variable by dragging the variable from the Symbol Browser and placing it onto the visual object.

Once the visual objects are defined and symbol addresses assigned, the Dashboard is brought to life by clicking on ‘Run’. Now uC/Probe loops sending commands to the target to access the mapped symbols (i.e. read/write MCU memory) and animates the visual objects on the Dashboard display accordingly.
Double-Duty Debugger
As a debugging aid, uC/Probe goes beyond the limitations of a typical MCU toolchain text-based display. For example, with uC/Probe you can graph the value of a variable over time while the target program runs. That is much easier than tediously stepping along using breakpoints and watch variables or trying to decipher a stream of PRINTF numbers flying off the screen.
Beyond debugging, thanks to the Ethernet connection option, uC/Probe can also do double duty in IoT applications by providing an easy way to monitor and control an embedded application across the Net.
The only caveat is that using the Ethernet option requires the target MCU to implement an Ethernet driver and UDP server to communicate with uC/Probe. As a practical matter that means the Ethernet option is typically only feasible for large MCUs with a lot of memory and MIPS to support a network stack while also running the target application.
However, taking advantage of the smart Ethernet chips from Wiznet, it is possible to use uC/Probe for IoT applications with small (i.e. 8/16-bit) MCUs. The Wiznet built-in ‘hardware stack’ offloads the networking burden and minimizes interference with the application. Let’s demonstrate the concept by showing how easy it is to get uC/Probe working across the Net with an Arduino.
Networking the Hard(ware) Way
The Arduino is already well-supported with Wiznet-based hardware and software. Hardware options include add-on Ethernet ‘Shields’ from Wiznet and many other suppliers (the design is open source), the Wiznet Wiz820io module (integrates the Wiznet chip with RJ45 Magjack) and combo Arduino+Ethernet SBCs such as the Seeed Studio Seeeduino Ethernet.

Better yet, there is plenty of time-proven software contributed by the Arduino community, notably including a UDP driver for the Wiznet Ethernet chips.
All that’s needed is a bit of code added to your Arduino application that handles the dialog with uC/Probe. That’s not a big deal since it’s just a matter of reading and writing memory locations.
Getting Virtual
Using the compiler symbol table to map visual objects to your application variables makes sense for debugging. But it does require reloading the uC/Probe symbol browser every time a program modification (i.e. new compile) changes the memory address assigned to a variable.
For IoT applications a convenient alternative is to adopt a ‘virtual’ address scheme. Technically speaking it means the mapping between a uC/Probe visual object and Arduino application variable (i.e. memory address) is determined by the application itself at runtime rather than by the compiler at compile time.
The virtual approach streamlines application & Dashboard development since the uC/Probe symbol browser only has to be loaded once initially, not every time the program (i.e. symbol address) changes. Applications also gain the ability to dynamically assign which variable (i.e. MCU memory address) is mapped to a Dashboard visual object. The virtual mapping scheme also works with other programming languages (ex: BASIC, Forth) that don’t produce a user-accessible or properly formatted symbol table file.
To Serve Man
Let’s go through an example showing how easy it is to get uC/Probe working with Arduino over Ethernet.
First open the ‘uCProbe_Server_Arduino’ program in the Arduino IDE and change the network parameters (MAC address, IP address and port number) to match your LAN setup.

Compile the program and download to your Arduino, and then open a terminal window to monitor program operation. When the program starts it displays a ‘Waiting for uCProbe packet…’ message and loops continuously displaying the value of the ‘slider’ variable. You can verify the Ethernet connection by PINGing the IP address you specified.
Next head over to www.micrium.com to download and install the evaluation version of uC/Probe, run it and then File->Open ‘Arduino_uCProbe_Demo.wspx’. The .wspx (workspace) file defines a Dashboard with a variety of visual objects including a dial and slider along with graphs, buttons, numeric fields, etc.
You can click on objects to explore and modify their properties. Also, click on the ‘Symbol Browser’ to see the ‘ArduinoMap.out’ virtually addressed symbol table. In this demo ten Arduino application variables (each of type byte, word or long) can be mapped to the Dashboard variables VAR01_type to VAR10_type (type = 08u, 16u or 32s).

To finish the setup click on the uC/Probe ‘Settings’ icon and enter the TCP/IP network parameters (IP address and port number) that you assigned to your Arduino.

Now hit the uC/Probe ‘Run’ icon, close the evaluation version alert and the Dashboard comes to life monitoring the Arduino application variables. Tweak the various Dashboard buttons and the slider (which are all mapped to a single variable) and the Arduino will display the activity on the terminal. Also notice how the panel lamp and traffic light images are animated, changing colors based on the value of their associated variables.

Under the Hood
Let’s take a closer look at how an Arduino application connects with uC/Probe. In this example, the application boils down to…

In the Arduino application, a ‘virtual address’ table maps the application variables (i.e. ‘slider’ and ‘dial’) to variables in the uC/Probe ArduinoMap.out symbol file that in turn link with the visual objects on the Dashboard screen.

The virtual to physical mapping is position-based. The first entry in the virtual address table (i.e. va[0]) corresponds to the first variable (group) in ArduinoMap.out (i.e. VAR01_08u, VAR01_16u or VAR01_32s). Remember that the uC/Probe and application connection is via Arduino memory references. Entries in the application virtual address table define the memory address while the type of the ArduinoMap.out variable (i.e. _08u, _16u, _32s) assigned to a Dashboard visual object defines the number of bytes (1, 2 or 4 respectively) transferred.
Roll Your Own
You can use the demo as a template for your own uC/Probe-connected Arduino application. Here are some ideas for tailoring the code to your own requirements.
To get a closer look at what’s going on behind the scenes you can uncomment code that displays the UDP traffic between the Arduino and uC/Probe.

Here you can see uC/Probe requesting a read of 0x0004 bytes from address 0x00000044 which is the virtual address of the application ‘Dial’ variable. The Arduino replies with 0x000002A7 which is 679 decimal.
Note that enabling packet display reduces the server throughput significantly. Once you’re done experimenting you can comment out the packet display code to speed things up. That also shrinks the code size to just 8,248 bytes, little more than a quarter of the 32KB available.
One basic design consideration is the timing relationship between the Arduino application and uC/Probe activity. In this demo the application runs continuously and handles uC/Probe requests along the way. This is the proper approach for an application doing any significant local processing.
However, if the main role of the application is simply to display something (ex: sensor reading) on the uC/Probe Dashboard then the application code can be moved inside the uC/Probe service so it only executes when uC/Probe makes a request. Try it with the demo server and notice how the dial moves much more slowly and smoothly. That’s because now the application only runs (i.e. increments the dial count) when uC/Probe makes a request rather than continuing to count up between uC/Probe requests.
When uC/Probe is used in its traditional role as a debugger, tracking target activity as fast (i.e. close to real-time) as possible is a worthy goal. But simple IoT applications with more leisurely timing can reduce overhead (on the Arduino, PC and network) by reducing the ‘Data Collection’ rate in the uC/Probe ‘Settings’.

The server has ‘multiuser’ capability i.e. multiple computers running uC/Probe can access a single Arduino. A software stack would no doubt struggle to service simultaneous requests from multiple uC/Probe clients. But the Wiznet hardware stack and on-chip RAM buffers enable the Arduino to handle multiple connections, all the moreso if the ‘Data Collection’ rate is throttled back.
A single computer can also run multiple instances of uC/Probe accessing an arbitrary mix of Arduinos. Multiple Dashboards can access a single Arduino or each Dashboard can link to a different Arduino.

Extending operation from LAN to WAN is as simple as changing the IP address in the uC/Probe TCP/IP settings to point to the remote Arduino. For example, you could access an Arduino at home from a uC/Probe Dashboard on your office PC by port forwarding to the Arduino via your home router. The only caveat is you need to be able to determine the IP address of your home router. A ‘Dynamic DNS’ (DDNS) service is an option if your router doesn’t have a static IP address,
No surprise that compared to LAN the throughput slows down for WAN depending on the transit time for the UDP packets. With assistance from Wiznet I ran a test with uC/Probe on my PC in California talking to an Arduino in South Korea. Throughput across the WAN dropped significantly with the Dashboard screen updating at a few Hz (instead of the few tens of Hz for LAN), but a few Hz is plenty fast enough for simple ‘dials & switches’ IoT applications.
While not a concern for a ‘trusted LAN’, extending uC/Probe operation to WAN does raise security concerns since uC/Probe has no encryption or other sophisticated security measures. The Arduino server does check the basic packet validity, so it will silently ignore UDP ‘probes’ that aren’t properly formed uC/Probe requests. Here are some other ways the application can provide additional security.
The server currently responds to uC/Probe requests from any IP address. One of the first mods you might consider is to check the IP address of an incoming request and only act on those from authorized IP addresses while giving unknown sources the silent treatment.
For applications that just monitor a remote system status you can easily modify the server to be ‘read-only’ (just comment out the write command handler) so no hacker will be able to corrupt Arduino memory. Yes, an eavesdropper can still see the Arduino replies to read commands, but unless they also have a copy of your Dashboard the data will be rather meaningless.
Another idea would be to implement a ‘passcode’ feature within the application using Dashboard buttons to implement a keypad. The application would confirm a proper passcode (use a rolling code to counter record&playback attacks) before allowing access.
DIoTY
uC/Probe makes it quick and easy to visualize IoT data across the Net, whether your home LAN or worldwide. With a large toolbox of useful drag&drop visual objects to choose from it only takes a few minutes to craft a pleasing and effective Dashboard display.
At the other end of the wire, the Wiznet ‘offload’ technology makes for a high-performance solution that works with any MCU, most notably small ones like Arduino. The Wiznet built-in ‘hardware stack’ protocol processing and RAM buffers insulate applications from the overhead and intrusiveness of network activity.
COMMENTS