MONITORING AND VISUALISING DUAL TEMPERATURE AND HUMIDITY SENSOR
We recently featured Plotly and discovered how easy it is to analyse and beautifully visualize data using their platform and API.
Now they shared with us a simple instructable to show to Arduino Community a hands-on experiment with ambient sensors:

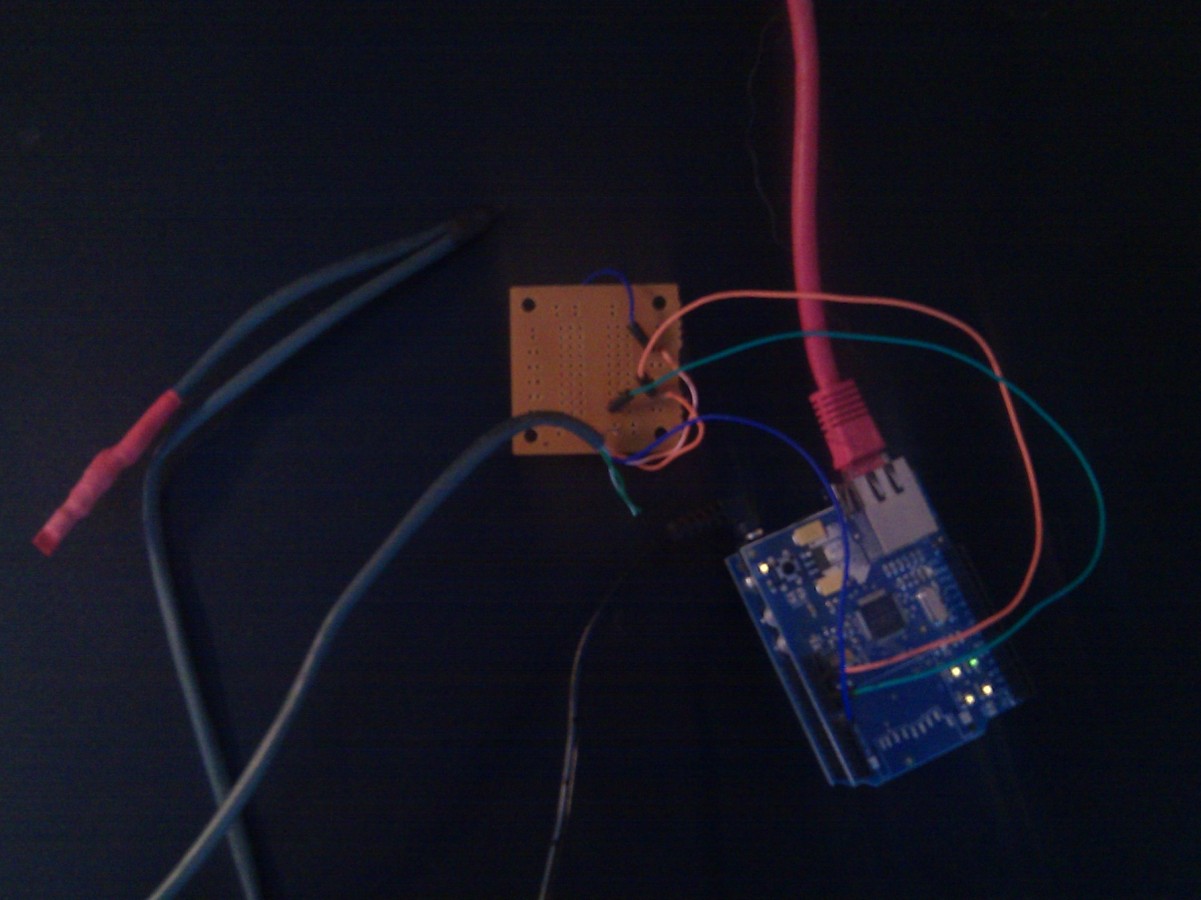
The purpose of this instructable is to demonstrate how to hook up an Arduino+ Ethernet Shield and send data to Plot.ly’s Servers and create beautiful graphs. We will be using a dual temperature+humidity sensor (DHT22), and sending the results directly to Plotly.
Follow these easy steps, here’s what you’ll need:

And this is an example of the output:

Source : https://blog.arduino.cc/2014/01/10/monitoring-and-visualising-dual-temperature-and-humidity-sensor/
Tags : 201401, W5100, Ethernet Shield, Arduino
Author : Mark Martin
COMMENTS