I needed a way of remotely monitoring the temperature and relative humidity in a greenhouse used by my local garden club. We grow and graft tomato plants for our annual plant sale. Careful control of the T and RH is helpful to insuring the success of the grafting process. Given the large T and RH changes that a greenhouse can experience it is useful to measure the conditions 24 hours a day, seven days a week for analysis. After exploring commercial recording hygrothermographs and determining the cost to be prohibitive I decided to build my own.
The basic design specs for this device were to have the ability to:
1. Measure T and RH with two separate sensors
2. Record the date, time, T and RH on an on-board memory card
3. Dump the contents of the memory card via web connection to the device
4. Upload real-time measurements to an IoT website
5. View the data graphically as a function of time
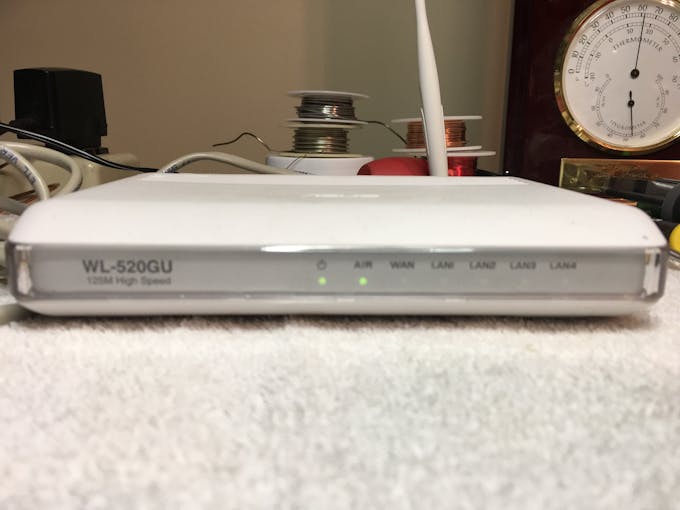
When I started the project a year ago I was an Arduino/IoT/C++ NOOB. The closest I had come to building something like this was replicating MightyOhm’s WiFi Radio based on a hacked ASUS WL-520GU router. As this project evolved the WiFi radio experience turned out to be very helpful. As you might imagine the project described in this tutorial is the result of countless iterations along a very interesting learning journey. This most recent iteration uses BME280 temperature, relative humidity and barometric pressure sensors. My previous version used DHT22 sensors. My thanks to everyone who has shared their learning, wisdom and code on the Internet. I would not have been able to write the code for this without all of the functions and code snippets that I borrowed from everyone who shared. I have tried to note and thank these authors at the top of my sketch and throughout this tutorial.
Software
- Arduino sketch- BME280_Recorder_C_Ethernet-GitHub.ino and make sure all of the libraries found on each
#includeline in the sketch are in your local Arduino IDE library.
- Clock Setting sketch such as this one. This sketch will enable you to set the time on your Real-Time Clock Module using the Arduino Mega and the LCD Keypad Shield.
- Cactus IO BME280 I2C Library- https://goo.gl/yWBL5G (This library is requiredfor dual BME280 sensor setups!)
- Simon Monk’s timer.h library- http://goo.gl/G 1XpT (for a description) and https://goo.gl/HPNM38 (Library)
Set the Date/Time on the Real-Time Clock Module
- Attach the push button LCD shield to the Arduino Mega. With jumper wires connect the 5V and GND on the RTC module to 5V and GND on the Arduino. Connect SDA, SCL on the RTC module to Arduino pins 20 and 21.
- Connect the Arduino to your computer via USB. Upload the time setting sketch. Follow the directions on the LCD and set the date and time.
- Disconnect everything and set the parts aside.
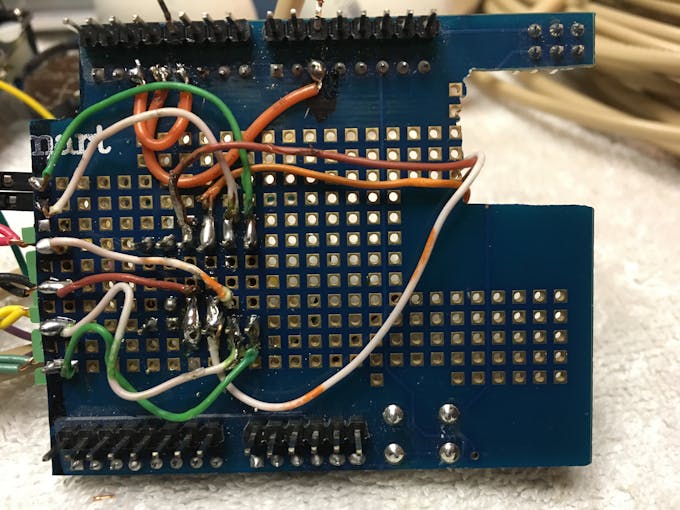
Prepare the proto-board
A proto-board is incorporated in this project because the Arduino Ethernet-SD shield and the Push Button LCD Display shield do not play nice together. They both use pin 10 and pin 4. Fortunately, this conflict can be handled in the sketch and on the proto-board.
The first thing you need to do is plug the proto-board into the Ethernet-SD shield. You may note that the Ethernet connector receptacle prevents you from plugging in the proto-board completely. If so, simply cut a slot in the proto-board to avoid the interference. I used a bandsaw to cut mine.
Rewire pins D10 to D3 and pin D4 to D2 as follows. Bend pins D10 and D4 on the proto-board so that they no longer plug into the Ethernet-SD shield. Or, you can simply cut them off. Using some insulated wire, solder a jumper from pin D10 to pin D3 and another jumper from pin D4 to pin D2. These pins are remapped in the sketch on line #63 LiquidCrystal lcd(8, 9, 2, 5, 6, 7); and the line #750 analogWrite(3,100); . The latter line sets the LCD backlight PWM dimming on pin D3. Cano64 published this solution at here.
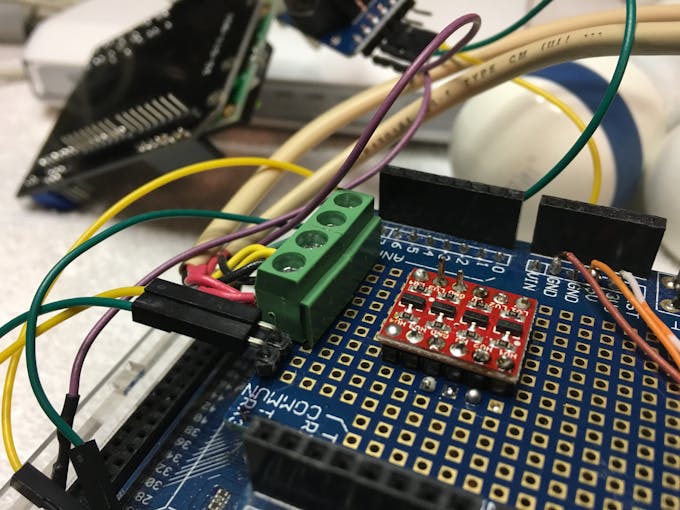
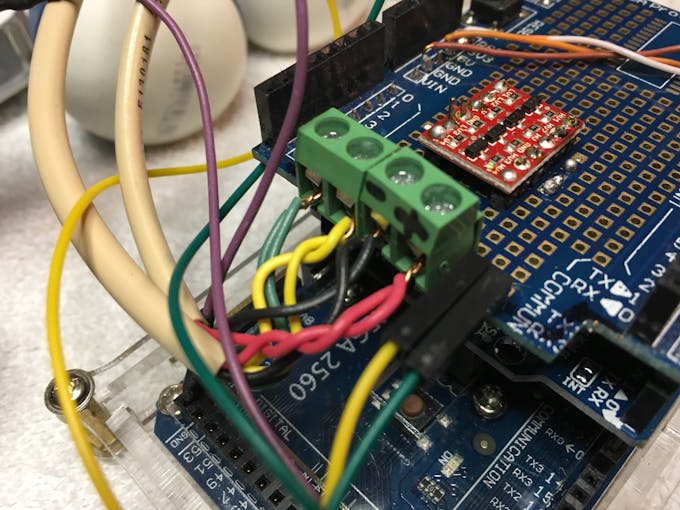
The proto-board can also be used to mount and connect the Sparkfun bi-directional logic level converter. This device is required for use with the BME280 as they operate at 3.3V. It is not entirely clear whether it is required in the I2C mode but it is required for SPI. Since I opted to use I2C and I fried two sensors with 5v instead of 3v in an early attempt (it pays to read spec sheets!), I opted to use the logic level converter to be safe. Wire it per the diagram. In my set-up I soldered header pins to the Logic Converter and then soldered it to the proto-board. If you want to set-up your sensors and logic level controller up on a breadboard before soldering- DO NOT SOLDER the logic level controller to the proto-board yet.
I also used PCB mount screw terminal blocks to connect the sensor wires to the proto-board. I used a right angle male header block for connecting SDA and SCL pins from the Arduino to the proto-board.
At this point you can assemble the shield stack: Ethernet-SD shield on the Arduino, proto-board on the Ethernet-SD shield, Pushbutton LCD on the proto-board.


Format a Micro-SD card:
Simply follow the directions that came with your card to format it as a FAT 16 or 32. The sketch needs a text file named HC_Data.txt to write the data to. Create this text file on your computer and save it on the SD card. Insert the SD card into the Ethernet-SD card slot.
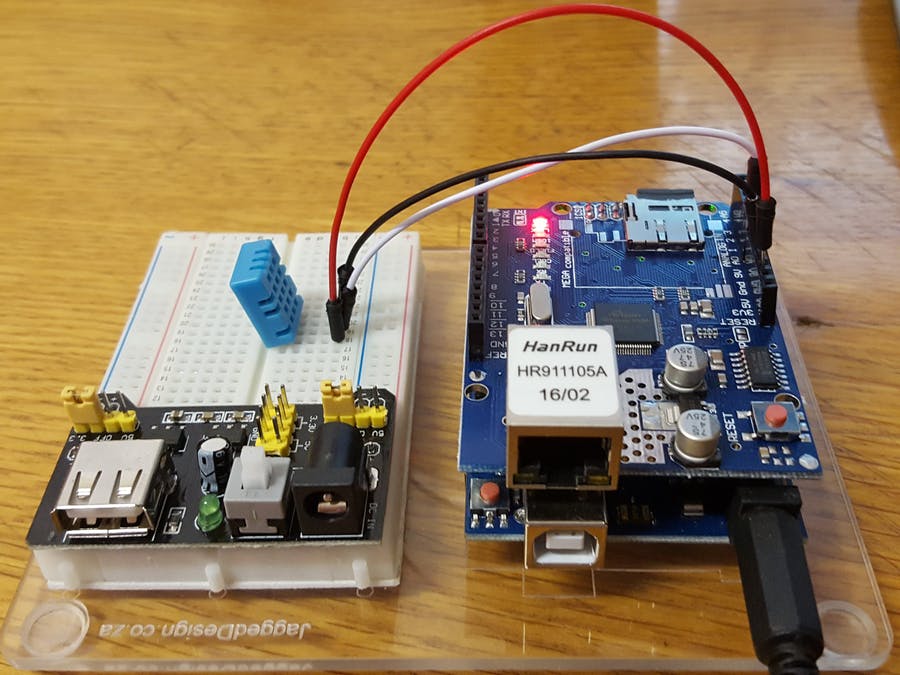
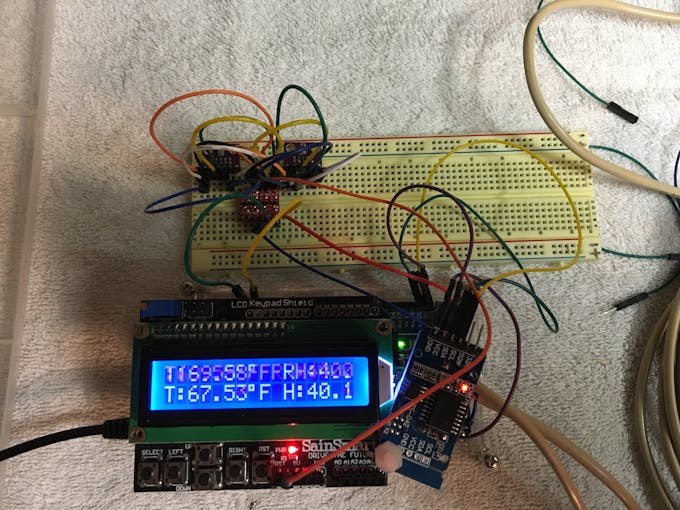
Testing your Rig on a Breadboard
The sketch is written to go through a boot-up process (see the video below) where it initializes devices and checks for the presence of others. It displays some of the steps on the LCD display and detailed steps on the serial monitor. Unfortunately, the sketch will stop very early in this process when it can’t find the BME280’s. If I was following this recipe, I’d fire it up anyway to see what happens—so go ahead if you want.
At this point you will have to think ahead and imagine how you want to deploy your BME280’s and decide whether you want to hardwire with to a four-wire cable or plug them into a female header or use screw connectors. This tutorial uses screw connectors on the proto-board and female header plug-in on the sensor end.
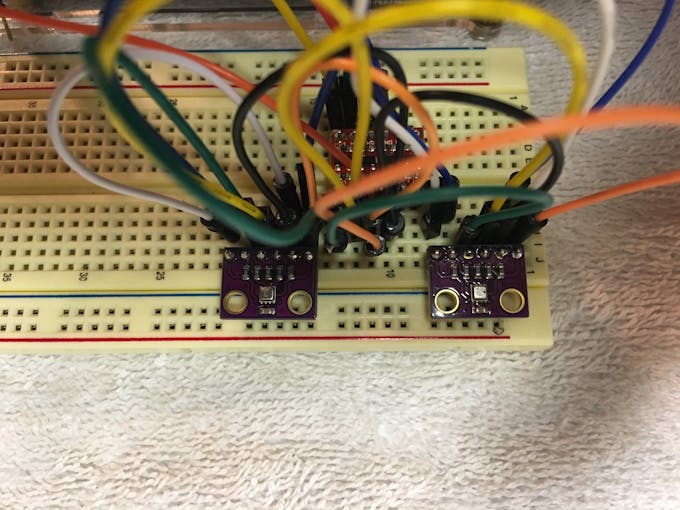
- Solder male header pins onto the BME280 boards.
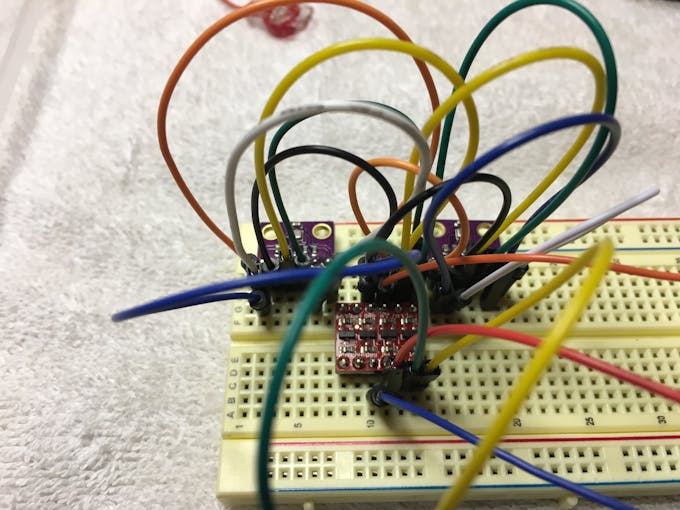
- Plug the BME280’s and logic converter into the breadboard.
- Wire the BME280’s with breadboard jumper wires as per the diagram.
Depending on the particular version of BME280 you purchased you may need to read the documentation and figure out how to connect them. The sketch works with these sensors through I2C communication requiring the sensors to have separate addresses (0x76 and 0x77). This happens by connecting Chip Select (CSB) to Vcc on both, and SDO to GND on one and SDO to Vcc on the other.
Note: There are four connector BME280’s available where the sensor address is changed by un-soldering a joint on the board — just make sure that your seller supplies documentation.
Create a ThingSpeak Account
Go to ThingSpeak.com. Open an account and a channel. The sketch writes data to seven Fields:
- Time
- Date
- BME1 Temperature
- BME1 Relative Humidity
- BME2 Temperature
- BME2 Relative Humidity
- BME1 Barometric Pressure
Set these fields up in ThingSpeak.
Copy and paste your Channel ID (found under the Channel Settings tab) and your Write API Key (found under the API Keys Tab) on lines 108 and 109 of the sketch.
Pick an IP address for your device to communicate through the ‘client-bridge ’ on your wi-fi network. The client-bridge router will be configured in later steps. It will need an IP address too. It should be something like 192.168.1.XXX where xxx is a number such as 55. It needs to be an unused address on your LAN. Enter that IP address on line 152 of the sketch. A MAC address is also set for the Ethernet communication on your network. It is set on line 139 and is currently BA:BA:BE:EF:BA. You can set this to anything that will be unique on your network.
If you haven’t uploaded the sketch at this point — do it now. (The most recent version of the sketch is named- BME280_Recorder_D_GITHUB.ino) With a little luck it will start running! Bring up the Serial Monitor on your computer so that you can see what the device is doing. Hopefully the sketch compiles and uploads. Since the client-bridge is not configured at this point it will not upload data to ThingSpeak.
Overview of the sketch
The sketch performs numerous functions:
1) As it begins execution in Setup() the sketch:
- Initializes and displays a greeting on the serial monitor
greeting(), and initializes the LCD and displays a greeting (line 938).
- Dims the LCD backlight with PWM (line 741)
- Accesses the date and time from the RTC and displays it on the serial monitor and LCD. If unsuccessful a warning is displayed. (from: Andrew Basterfield, AlarmClock, https://goo.gl/Heigw1 and Sparkeys Widgets, https://goo.gl/BUaKya)
- Checks the BME 280 sensors to ensure they are connected and displays their state on the LCD and serial monitor. If unsuccessful the sketch halts.
- Obtains and displays the local IP address of the client-bridge
- Initializes the SD card, and warns if it is not present. It opens and determines the SD card type, volume type, volume size and will display all the files in the volume by uncommenting lines 909-920.
2) It scrolls the data readout on line one of the LCD Display moving the digits right to left every 400 milliseconds (from: Nishant Arora-https://goo.gl/qPGpWB)
3) It reads BME280-1 and BME280-2 consecutively every 3100 milliseconds. It accumulates 20 readings and computes an average every ~62 seconds.
4) It writes these averages from both sensors with the time and date to the SD card (from: toptechboy.com).
5) It uploads the averages from both sensors with the time and date to ThingSpeak every 63 seconds.
6) It has a web server that listens for remote requests. When receiving a request it will dump the contents of the SD card to the requester (From: javacasm for WebServerDataLogger).
I employed Simon Monk’s Timer.h library to take care of the time sequencing of events. You may notice that the scrolling digits on the LCD will occasionally every 63 seconds. The update to ThingSpeak takes 1-2 seconds. In that moment the display scroll has to wait for the update to occur before it can move again.
Configuring the Client Bridge:
When I started experimenting with this device I was reluctant to use an Arduino WiFi shield due to the cost, potential coding challenges and possible power requirements. Since I had some experience hacking routers with DD-WRT and Open-wrt I opted to go this way although the WiFi route in hindsight is likely much cleaner (but, I’ve never tried it). Configuring the router to client bridge mode was the most frustrating part of this project. Note that there are numerous DD-WRT versions each designed for specific routers and the interface is slightly different for each one.
For the unfamiliar- you will be flashing the firmware memory in your compatible router with DD-WRT in the same way you would install a firmware update. DD-WRT replaces the stock OS with a new OS and a completely different router interface.
Explore the DD-WRT website. This page allows you to enter router model numbers to determine compatibility and to download the appropriate version of DD-WRT. Install.
Configure the router in Client bridge mode. The instructions are here-https://goo.gl/uWVG16 (follow them exactly!). When you have it configured correctly and connected to your computer it should give you a wireless Ethernet connection to your LAN and WAN.
- Connect it to the Arduino and restart the sketch.
- Check ThingSpeak to determine if your data is uploading.
- Type the web address of your router into a web browser. It should begin to download the data on the SD card.
Protecting the BME280’s:
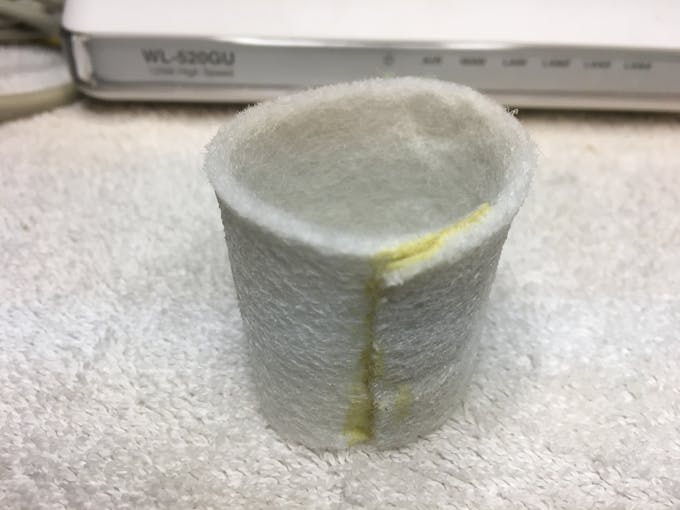
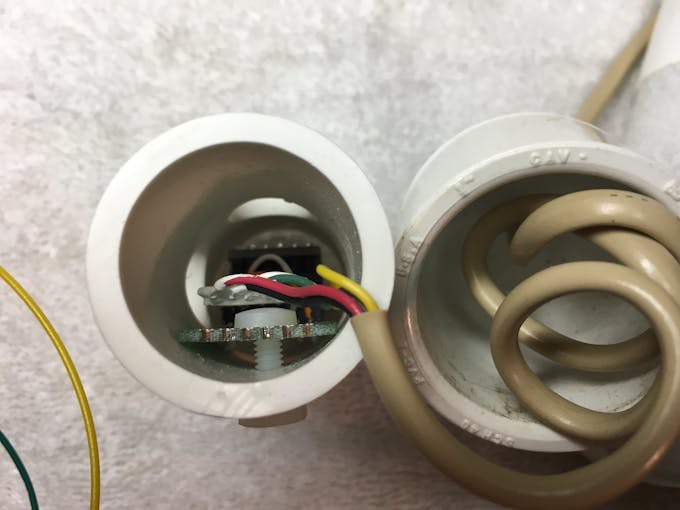
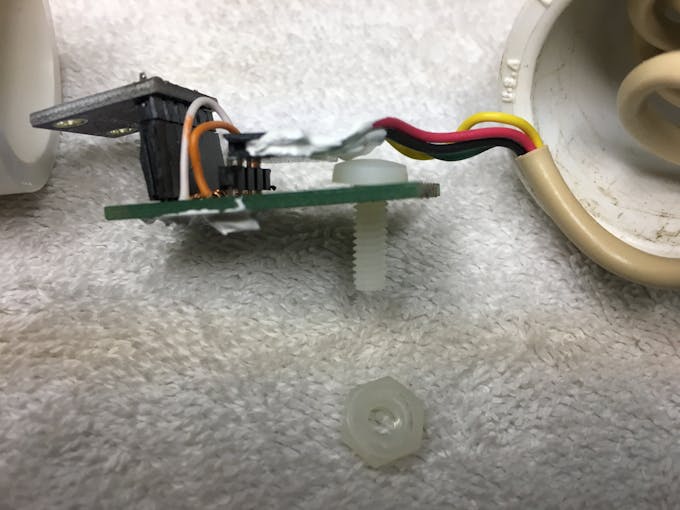
I was unable to find any information outlining best practices for protecting the BME280’s from the environment. I know from my experience with DHT-22’s in earlier iterations of this device that the greenhouse environment where they operate is harsh particularly with dust (and stray water). I designed and built simple protective covers for the sensors from 1” PVC Pipe and pipe caps. I used Double Side Prototype PCB Universal Printed Circuit Board as a platform to connect the sensor wires from the Arduino as well as to create a plug-in mount for the sensor with a female header. I have another version that uses 2P 5mm Pitch PCB Mount Screw Terminal Blocks to connect the four-wire sensor cable from the Arduino. I drilled four 3/8 in holes around the periphery of ~ 4 inch section of PVC pipe to allow airflow around the sensor. The board is held in place inside the tube with a nylon screw and nut. Protective sleeves were made from 50 micron Polishing Filter media. Contact cement is used (two coats were required) to create a seam in the sleeve.


Closing thoughts:
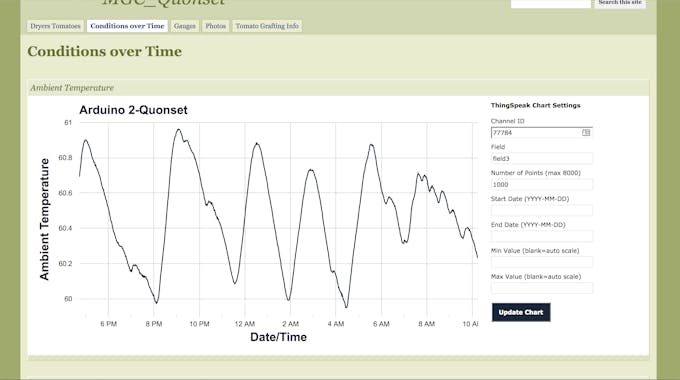
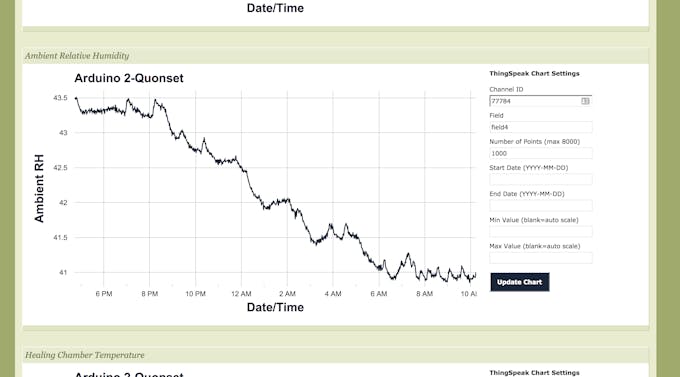
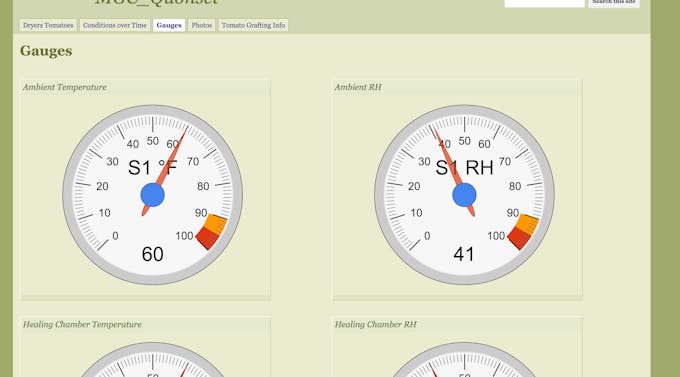
While ThingSpeak provides an extremely reliable and easy to use service (and it’s priced right too-FREE!) I was not satisfied with the graphical capability they provide. My data on ThingSpeak is displayed here and here. I invested a significant amount of time looking for a better graphing capabilities on other IoT sites. I explored every free IoT service that I could find and found most to be difficult or impossible to get running. None of them yielded better graphing capabilities. The journey led me to FatCat Labs in NYC one night for Arduino Tuesday. One of the participants suggested that I was “going about this the wrong way” and that I should “create a website and use Google Charts” to display the data. In the moment I was frustrated with his advice as the last thing I wanted to do was to create a website. But, on the train ride home I came to grips with his advice and decided to go for it. I started messing around with Google Charts and didn’t get very far until I discovered a brilliant solution shared by Mike Teachman. His code and instructions for using it are on GitHub (use the one labeled as ‘new version‘). You can see my graphs using his code here and here. It is possible to use Google Graphs to display the data on gauges. I modified the gauge code on ThingSpeak’s private channel to make these gauge gadgets. The code for the Barometric Pressure gauge is here. You will have to add your channel number and read API key. If you want to experiment with the code parameters you can run it on JSFIDDLE. Just copy the code into the HTML section enter your ThingSpeak channel number and API read code and click RUN. It will display your gauge in the right hand panel.


Barometric Pressure Readings
Unless you live at sea-level the barometric pressure readings will be different than what is reported by your favorite local weather station. All reported barometric pressure readings are corrected to sea level. Thus, knowing the sea level BP and your device BP you can calculate your altitude. Or, if you know your altitude you can calculate a correction factor. You can find a detailed explanation here.
Deploying it in the Field
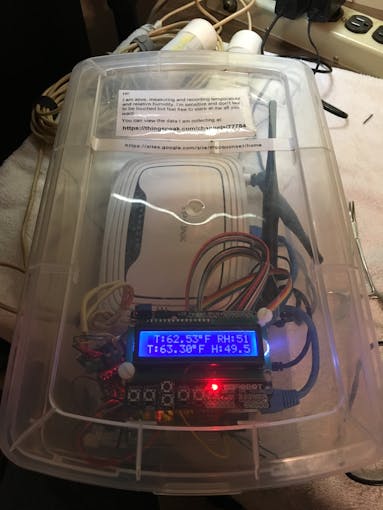
I have two of these devices. One I keep at home for development and experimenting with tomato grafting. The other is deployed in the greenhouse where we use a Verizon hotspot for the Internet connection. In the photos below you can see how I protect it from dust, water and curious hands. The plastic box is from Home Depot (shoe box ~$3). The Arduino is held in place with nylon screws and nuts through holes in the bottom of the box. The client-bridge router is held in place with Velcro tape. I don’t use a proto-board in this version. Instead the remapping of D10 and D4 is done with the ribbon cables. The logic level converter is mounted on a small board and uses screw connectors to connect the sensors. I used a few coats of Liquid Electrical Tape on the back side of this board to protect the wiring from shorting. The logic level converter board and the Real-time Clock plug into female headers on another board to keep them out of the way. The power and sensor wires pass through holes with grommets on the sides of the box.
COMMENTS