1. Introduction
2. Sensors Selection in Respect of Measurement Accuracy of Physical Parameters
We have developed our prototype with the aim to use it in a traditional naturally ventilated single-sloped greenhouse, considering the environmental conditions data collected by Hua et. al [20] in a measurement campaign in order to validate their deterministic and stochastic model for estimation of greenhouse microclimate. In particular, in this kind of greenhouse there is a daily variation temperature in the range between 10 °C to 40 °C and a daily relative humidity (RH) from 10% to about 90%. As a matter of facts, our electronic platform has been designed to guarantee best performances in these environmental conditions. The board permits to collect a set of measurements of the main greenhouse environment parameters, with an accuracy reported in Table 1, according to data collected by Hua et. al. On the basis of these specifications, for each physical parameter can be chosen a sensor for performing measurements, from the analysis of the state of art.
| Physical Parameter | Measurement Accuracy |
|---|---|
| Air temperature | 0.1 °C |
| Air humidity | 1% UR |
| Solar radiation | 5 W/m2 |
| Air velocity | 0.1 m/s |
| CO2 concentration | 0.01% |
3. Methods: Design and Development of the Electronic Board
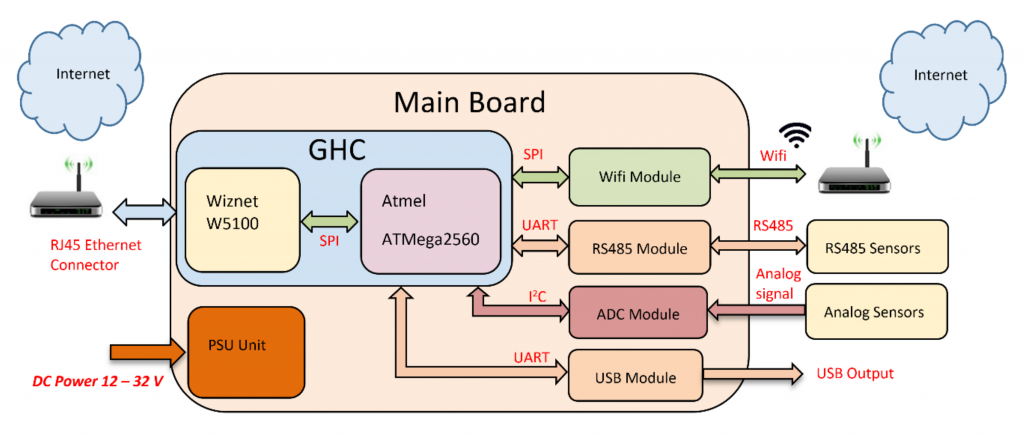 Figure 1. Block diagram of the electronic board.
A 3D view of the board with its modules integrated in the Main Board, is shown in Figure 2. Each module has been descripted in the following sub-sections.
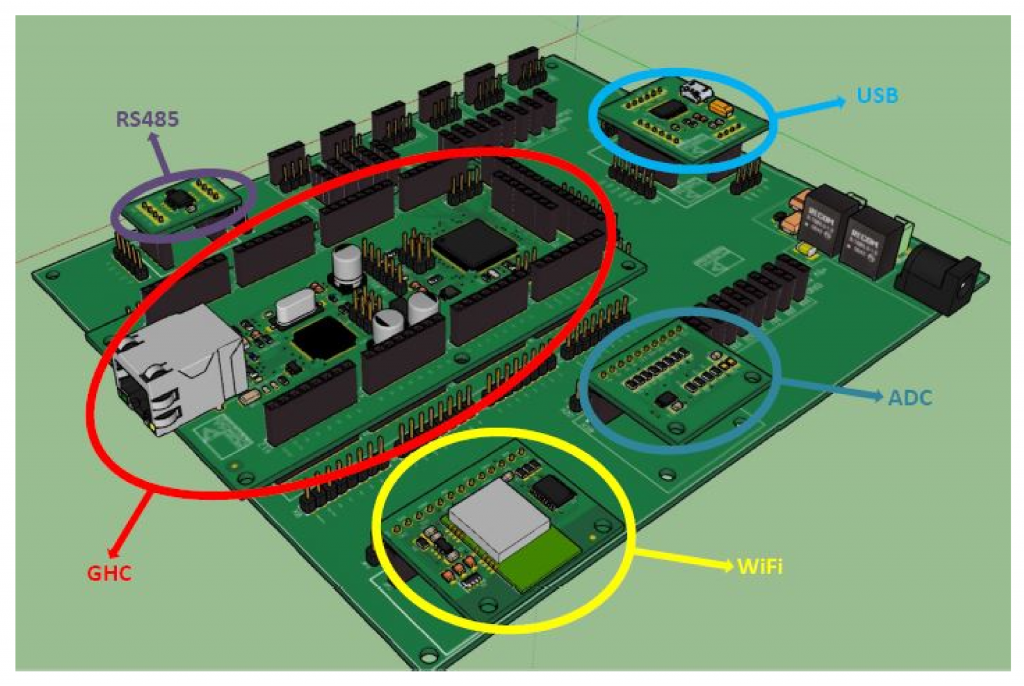 Figure 2. 3D view of the electronic board.
In order to allow on-site use, a dedicated box has been designed, using an appropriate CAD, to protect the board from environmental agents, such as weather conditions, fertilizer emission, intrusion, dust, accidental contact and water. For these reasons, the development of the box has respected the IEC standard 60529-IP56 [32]. The box has six holes (one for power supply, one for Ethernet port and four for external sensors) in order to permits connections between board and sensors, power supply and internet gateway. For assembling the board on the box, four 5-mm diameter rounded turrets have been designed and positioned on each box angle. The box size is 172 × 192 × 110 millimeters.
Figure 3 shows a 3D view of the box.
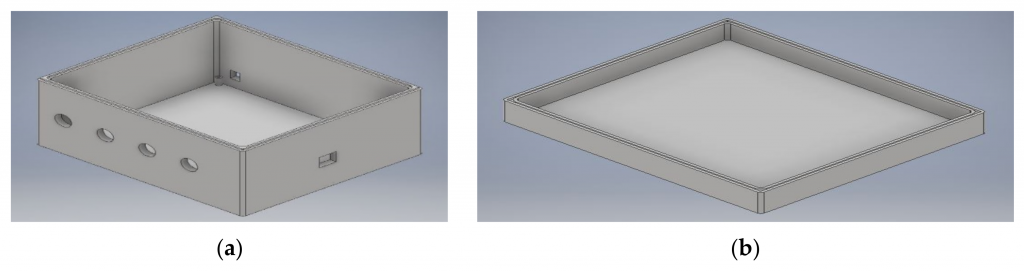 Figure 3. A 3D view of the board dedicated box: (a) base of the box; (b) box cap.
3.1. Green House Core (GHC)
The Green House Core module contains the core of the board and consequently it permits to manage all modules intended to data acquisition and communication. In particular, 8-bit Atmel ATmega2560-16AU microcontroller (Table 2) has been chosen [33]. We have selected an 8-bit platform, instead of a more recent 32-bit platform, as well as for the economic aspect, for the following main reasons [34,35,36]:
| Maximum clock frequency | 16 MHz |
| Programmable memory | Flash |
| Flash capability | 256 kB |
| CPU speed | 16 MIPS |
| EEPROM | 4 kB |
| SRAM | 8 kB |
| I/O pin | 86 |
| PWM resolution | 16-bit |
| PWM channels | 12 |
| Serial UARTs | 4 |
| Serial SPI | 5 |
| Serial I2C | 1 |
| ADC resolution | 10-bit |
| ADC channels | 16 |
| Timers/Counters | 2 × 8-bit, 4 × 16-bit |
| Temperature range | −40–85 °C |
| Voltage supply | 4.5–5.5 V |
| Max Current supply | 14 mA |
- The majority of 8-bit devices are proposed in DIP packaging. This aspect makes them easy to plug into a breadboard and get starting with the prototype experiments, guaranteeing a fast and easy solution.
- Most 8-bit devices run on 5 volts, as well as the ATmega2560-16AU microcontroller. 5-volt systems provide better noise immunity and the majority of industry standard modules use 5-volt logic levels, as you can see from most of selected chips of our board.
- 8-bit devices are robust and it results harder to damage an 8-bit device than a 32-bit device [34].
- The use of an 8-bit device guarantees a low and fast learning curve as concerns the firmware development [34].
- Many modern microcontrollers incorporate some hardware functions that serve to help the CPU operate as efficiently as possible, such as the Peripheral Event System, which allows peripherals to interact without intervention from the CPU. In the case of detecting a hardware event, it is important to first detect the event and then switch control to the desired interrupt service routine (ISR). In these situations, CPU speed isn’t the single determining factor. It is a question of how long, in terms of cycles, does it take to respond to the interrupt, run the ISR, and return. As shown in Table 2 of [35], 8-bit devices can be more efficient in handling hardware near actions. In fact, the average clock cycles employed in an 8-bit MCU are lower than 32-bit MCU (i.e., for detect interrupt, jump to interrupt vector, return from interrupt, etc.).
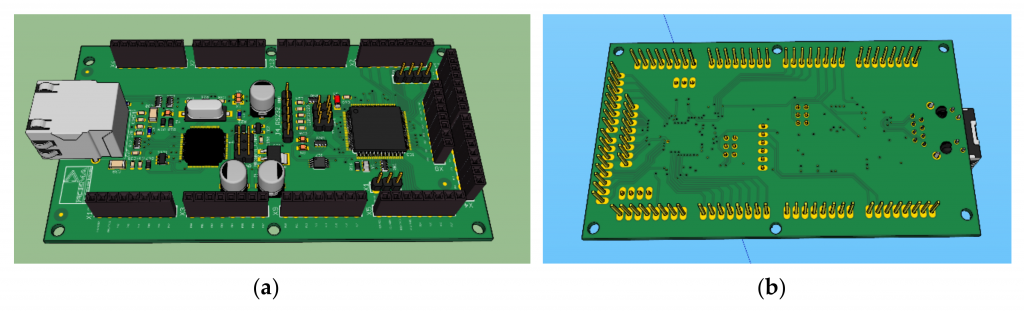 Figure 4. A 3D view of the GHC module: (a) front side; (b) back side.
3.2. Wi-Fi Module
| Transmitting/Receiving frequency band | ISM, 2.4 GHz |
| Transmitting/Receiving rate | 20 MHz |
| Output power | 20.6 dBm |
| CPU speed | 16 MIPS |
| Communication protocols | SPI, UART, I2C |
| SRAM | 8 kB |
| Flash memory | 4 Mb |
| Voltage supply | 1.8 V, 2.5 V, 3.3 V |
| Max Current supply | 269 mA |
| Temperature range | −40–85 °C |
Since the maximum voltage supply of this chip and also its communication signals have a voltage equal to 3.3 V, a voltage stabilizer and a level shifter have been used for adapting 5 V to desired voltage of 3.3 V. As well as the GHC module, three LEDs (i.e., red, yellow and green) have also been inserted in the Wi-Fi module, for noticing the state of the module during firmware testing and developing phase. Figure 5 shows front side and back side of the 3D Wi-Fi module.
 Figure 5. A 3D view of the Wi-Fi module: (a) front side; (b) back side.
3.3. RS485 Module
 Figure 6. A 3D view of the RS485 module: (a) front side; (b) back side.
Table 4. Specifications of the Maxim Integrated MAX3468CSA chip used in the RS485 module.
| Communication protocols | RS422, RS485 |
| Data rate | 40 Mb/s |
| Number of receivers | 1 |
| Receiver delay | 20 ns |
| Number of transmitters | 1 |
| Transmitter delay | 15 ns |
| Maximum number of transceivers on the bus | 128 |
| Voltage supply | 4.75–5.25 V |
| Max Current supply | 2.5 mA |
| Temperature range | 0–70 °C |
3.4. ADC Module
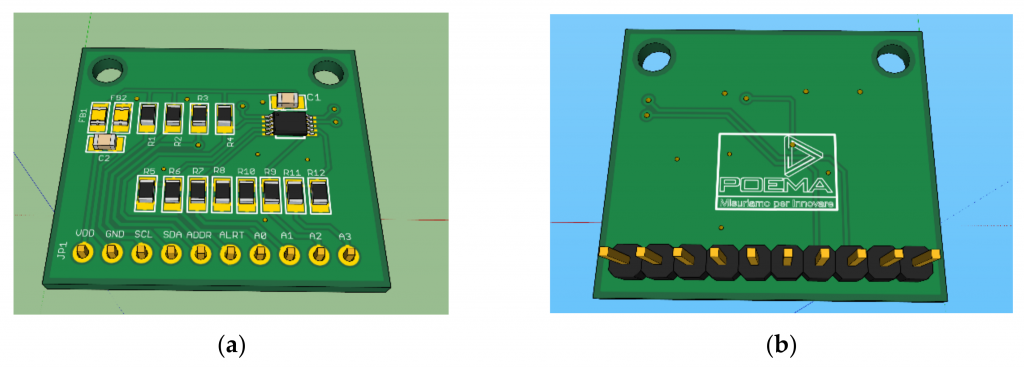 Figure 7. A 3D view of the ADC module: (a) front side; (b) back side.
| Bit resolution | 12-bit |
| Sampling frequency | 3.3 ksps |
| Input channels differential (single-ended) | 2 (4) |
| Number of transmitters | 1 |
| Communication protocol | I2C |
| Voltage supply | 2.0–5.5 V |
| Max Current supply | 150 uA |
| Temperature range | −40–125 °C |
3.5. USB Module
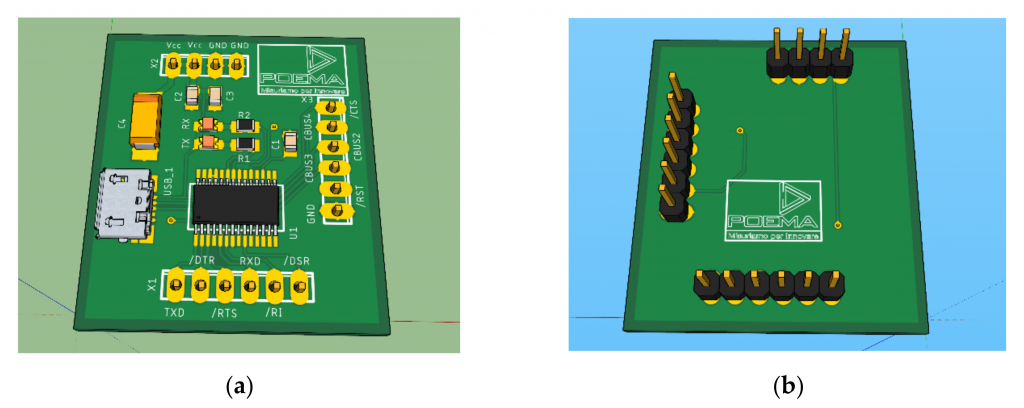 Figure 8. A 3D view of the USB module: (a) front side; (b) back side.
| USB standard | 2.0 |
| Frequency | 12 MHz |
| Data rate | 12 Mb/s |
| EEPROM | 1024 bit |
| Voltage supply | −0.5–6.0 V |
| Max Current supply | 24 mA |
| Temperature range | −40–85 °C |
3.6. Main Board
The Main Board hosts the other modules (the GHC module, the Wi-Fi Module, the RS485 Module, the ADC Module and the USB Module) and guarantees power supply, filtering and protection to each of them thanks to Power Supply Unit (PSU) module (see Figure 1). Since one of the aims of the board concerns prototyping firmware and software in order to make the most of device performances, the Main Board has been designed without any strict electrical connection between various modules hosted (see Figure 9). In this way, it is possible to connect various modules as needed of the firmware and software developer (input/output ports selected, timer, pin optimization, etc.), which should program the board using an In Circuit Serial Programming (ICSP) interface. The board is 12–32 V powered and it provides, thanks to on-board DC converter [42], two different voltages, 12 V and 5 V, according to needs. In fact, the other modules are developed to operate with a 5 V power supply, whereas all sensors could be fed to 5 V, 12 V and 24 V power supply [24,25,26] and [28,29]. A power consumption calculation has been done in order to evaluate the maximum power supply for each module and consequently the maximum power consumption of our electronic board. In the calculation, the power consumption of outline electronics, such as resistors, capacitors, etc., is considered negligible compared to main modules consumption. The calculation is obtained considering maximum current (Imax) and voltage (Vmax) supply, in the worst case, of every chips involved in the board, using the following formula:
where m is the number of modules involved in the prototype. In Table 7, the maximum Voltage supply (Vmax), the maximum current supply (Imax) and the maximum power supply (Pmax) for each module are reported. Using the previous formula, the maximum power consumption of our prototype is equal to about 1619 mW. Since the board is 12 V–32 V powered, we have also calculated the energy consumption for each voltage, with the following formula:

Table 7. Power consumption calculation.
| Module | Chip | Maximum Voltage Supply [V] | Maximum Current Supply [mA] | Maximum Power Consumption [mW] |
|---|---|---|---|---|
| GHC | Atmega2560 | 5 | 14 | 70 |
| Ethernet | Wiznet W5100 | 3.3 | 160 | 528 |
| Wi-Fi | ATWINC1500_MR210PA | 3.3 | 269 | 887.7 |
| RS485 | MAX3468CSA | 5 | 2.5 | 12.5 |
| ADC | ADS1015 | 5 | 0.150 | 0.750 |
| USB | FT232R | 5 | 24 | 120 |
Consequently, the energy consumption decreases when the Voltage powered increases.
4. Results: Prototype Realization and Dedicated Firmware and Software Development


4.1. Development of the Dedicated Firmware

In order to investigate the stability of the acquired data and the results of the data elaboration using the UKF, we have tested the board during a time acquisition window of 30 s. The experiment has been studied with the goal of simulating a typical use scenario of the board. A resistive potentiometer has been powered by the board with a voltage of 5 V, and its voltage reading has been stored and elaborated using the UKF by the board. We have decided to test the board for voltages reading between 500 mV and 2000 mV, that are typical values of commercial sensors. In Figure 13 are shown the graphical results of the experiment.


4.2. Development of the Dedicated Software and Web Application

5. Discussion and Conclusions
Author Contributions
Funding
Conflicts of Interest
References
- Gubbi, J.; Buyya, R.; Marusic, S.; Palaniswami, M. Internet of Things (IoT): A vision, architectural elements, and future directions. Futur. Gener. Comput. Syst. 2013, 29, 1645–1660. [Google Scholar] [CrossRef]
- Qiu, W.; Dong, L.; Wang, F.; Yan, H. Design of intelligent greenhouse environment monitoring system based on ZigBee and embedded technology. In Proceedings of the 2014 IEEE International Conference on Consumer Electronics, Shenzhen, China, 9–13 April 2014; pp. 1–3. [Google Scholar]
- Marsh & McLennan Companies. Agriculture 4.0: The Future of Farming Technology. Available online: https://www.mmc.com/content/dam/mmc-web/insights/publications/2018/november/agriculture-4-0/Oliver-Wyman-Agriculture-4.0.pdf (accessed on 27 April 2020).
- Rangan, K.; Vigneswaran, T. An Embedded systems approach to monitor green house. In Proceedings of the International Conference on Recent Advances in Space Technology Services and Climate Change 2010 (RSTS & CC-2010), Chennai, India, 13–15 November 2010; pp. 61–65. [Google Scholar]
- Candido, A.; Cicirelli, F.; Furfaro, A.; Nigro, L. Embedded real-time system for climate control in a complex greenhouse. Int. Agrophys. 2007, 21, 17–27. [Google Scholar]
- Montoya, F.G.; Gómez, J.; Cama, A.; Zapata-Sierra, A.J.; Martínez, F.; De La Cruz, J.L.; Manzano-Agugliaro, F.; Cama-Pinto, A. A monitoring system for intensive agriculture based on mesh networks and the android system. Comput. Electron. Agric. 2013, 99, 14–20. [Google Scholar] [CrossRef]
- Kumar D.N., N. ARM based remote monitoring and Control System for environmental parameters in greenhouse. In Proceedings of the 2015 IEEE International Conference on Electrical, Computer and Communication Technologies (ICECCT), Coimbatore, India, 5–7 March 2015. [Google Scholar]
- Yuquan, M.; Shufen, H.; Qingzhu, W. New environment parameters monitoring and control system for greenhouse based on master-slave distributed. In Proceedings of the 2010 International Conference on Computer and Communication Technologies in Agriculture Engineering, Chengdu, China, 12–13 June 2010; Volume 1, pp. 31–35. [Google Scholar]
- Ahonen, T.; Virrankoski, R.; Elmusrati, M. Greenhouse Monitoring with Wireless Sensor Network. In Proceedings of the 2008 IEEE/ASME International Conference on Mechtronic and Embedded Systems and Applications, Beijing, China, 12–15 October 2008; pp. 403–408. [Google Scholar]
- Pahuja, R.; Verma, H.; Uddin, M. A Wireless Sensor Network for Greenhouse Climate Control. IEEE Pervasive Comput. 2013, 12, 49–58. [Google Scholar] [CrossRef]
- Somov, A.; Shadrin, D.; Fastovets, I.; Nikitin, A.; Matveev, S.; Seledets, I.; Hrinchuk, O. Pervasive Agriculture: IoT-Enabled Greenhouse for Plant Growth Control. IEEE Pervasive Comput. 2018, 17, 65–75. [Google Scholar] [CrossRef]
- Dan, L.; Xin, C.; Chongwei, H.; Liangliang, J. Intelligent Agriculture Greenhouse Environment Monitoring System Based on IOT Technology. In Proceedings of the 2015 International Conference on Intelligent Transportation, Big Data and Smart City, Halong Bay, Vietnam, 19–20 December 2015; pp. 487–490. [Google Scholar]
- Chen, X.; Guo, P.; Lan, Y. Design and experiment based on wireless sensor network with 780 MHz in greenhouse. Trans. Chin. Soc. Agric. Eng. 2014, 30, 113–120. [Google Scholar]
- Li, W.; Luo, Q.; Li, Z.; Li, Y. The Design and Implementation of a Low Cost Temperature Control System for Agriculture Greenhouses. In Proceedings of the 2009 International Conference on Energy and Environment Technology, Guilin, China, 16–18 October 2009; Volume 1, pp. 399–401. [Google Scholar]
- Tsai, C.-F.; Hung, K.-C. Campus greenhouse monitoring with a simple ZigBee-based sensor network. In Proceedings of the 2016 International Conference on Advanced Materials for Science and Engineering (ICAMSE), Tainan, Taiwan, 12–13 November 2016; pp. 305–308. [Google Scholar]
- Geng, X.; Zhang, Q.; Wei, Q.; Zhang, T.; Cai, Y.; Liang, Y.; Sun, X. A Mobile Greenhouse Environment Monitoring System Based on the Internet of Things. IEEE Access 2019, 7, 135832–135844. [Google Scholar] [CrossRef]
- Vimal, P.V.; Shivaprakasha, K.S. IOT based greenhouse environment monitoring and controlling system using Arduino platform. In Proceedings of the 2017 International Conference on Intelligent Computing, Instrumentation and Control Technologies (ICICICT), Kannur, India, 6–7 July 2017; pp. 1514–1519. [Google Scholar]
- Lee, W.S.; Alchanatis, V.; Yang, C.; Hirafuji, M.; Moshou, D.; Li, C. Sensing technologies for precision specialty crop production. Comput. Electron. Agric. 2010, 74, 2–33. [Google Scholar] [CrossRef]
- Park, D.-H.; Park, J.-W. Wireless Sensor Network-Based Greenhouse Environment Monitoring and Automatic Control System for Dew Condensation Prevention. Sensors 2011, 11, 3640–3651. [Google Scholar] [CrossRef] [PubMed]
- Hua, Y.; Qi-Fang, L.; Huai-Qing, Y. Deterministic and stochastic modelling of greenhouse microclimate. Syst. Sci. & Control Eng. 2019, 7, 65–72. [Google Scholar]
- Fenner, R.; Zdankiewicz, E. Micromachined water vapor sensors: A review of sensing technologies. IEEE Sensors J. 2001, 1, 309–317. [Google Scholar] [CrossRef]
- Rittersma, Z. Recent achievements in miniaturised humidity sensors—A review of transduction techniques. Sens. Actuators A Phys. 2002, 96, 196–210. [Google Scholar] [CrossRef]
- Chen, Z.; Lu, C. Humidity Sensors: A Review of Materials and Mechanisms. Sens. Lett. 2005, 3, 274–295. [Google Scholar] [CrossRef]
- Nesa srl. Available online: https://www.nesasrl.eu/media/pdf/UTA.pdf (accessed on 25 October 2019).
- Lima, A.M.N.; Deep, G.; Neto, J.; Freire, R.C.S.; Lobo, P. Identification of thermoresistive solar radiation sensors. IEEE Trans. Instrum. Meas. 1994, 43, 133–138. [Google Scholar] [CrossRef]
- Nesa srl. Available online: https://www.nesasrl.eu/media/pdf/RSG1.pdf (accessed on 25 October 2019).
- Dubov, D.; Aprahamian, B.; Aprahamian, M. Comparison of Wind Data Measurment Results of 3D Ultrasonic Anemometers and Calibrated Cup Anemometers Mounted on a Met Mast. In Proceedings of the 2019 16th Conference on Electrical Machines, Drives and Power Systems (ELMA), Varna, Bulgaria, 6–8 June 2019; pp. 1–5. [Google Scholar]
- Gill Instruments: Meteorological Technology. Available online: http://www.gillinstruments.com/data/datasheets/1210-0012%20R3-50%20Iss%202.pdf (accessed on 25 October 2019).
- SplusS Regeltechnik. Available online: https://spluss.de/fileadmin/assets/ACO2-SD-TYR2__IT-safe.pdf(accessed on 25 October 2019).
- Wang, Y.; Nakayama, M.; Yagi, M.; Nishikawa, M.; Fukunaga, M.; Watanabe, K. The NDIR CO/sub 2/ monitor with smart interface for global networking. IEEE Trans. Instrum. Meas. 2005, 54, 1634–1639. [Google Scholar] [CrossRef]
- Autodesk EAGLE. Available online: https://www.autodesk.com/products/eagle/overview (accessed on 25 October 2019).
- IEC Standard 60529. Available online: https://www.iecee.org/ (accessed on 2 April 2020).
- Microchip ATmega2560. Available online: https://www.microchip.com/wwwproducts/en/ATmega2560(accessed on 25 October 2019).
- Trinirobotics, The word of Electronics in One Place. 8-bit VS 32-bit Microcontrollers: Which should I choose? Available online: https://trinirobotics.com/2019/03/23/8-bit-vs-32-bit-microcontrollers-which-should-i-choose/ (accessed on 24 March 2020).
- Electronic Design. 8 Bit or 32 Bit? Choosing Your Next Design’s MCU. Available online: https://www.electronicdesign.com/technologies/microcontrollers/article/21800448/8-bit-or-32-bit-choosing-your-next-designs-mcu (accessed on 24 March 2020).
- Altium. 8-bit vs. 32-bit MCU: Choosing the Right Microcontroller for Your PCB Design. Available online: https://resources.altium.com/pcb-design-blog/8-bit-vs-32-bit-mcu-choosing-the-right-microcontroller-for-your-pcb-design (accessed on 24 March 2020).
- WIZnet W5100. Available online: https://www.wiznet.io/product-item/w5100/ (accessed on 25 October 2019).
- Microchip ATWINC1500. Available online: https://www.microchip.com/wwwproducts/en/ATwinc1500(accessed on 25 October 2019).
- Mouser Electronics. Available online: https://www.mouser.it/Search/Refine?Keyword=MAX3468CSA(accessed on 25 October 2019).
- Texas Instruments. Available online: http://www.ti.com/product/ADS1015 (accessed on 25 October 2019).
- Future Technology Devices International Ltd. Available online: https://www.ftdichip.com/ (accessed on 25 October 2019).
- Recom DC Converter R-78B-2.0. Available online: https://eu.mouser.com/datasheet/2/468/R-78B-2.0-1711238.pdf (accessed on 7 April 2020).
- Losacco, M.; Schirru, L. Orbit Determination of Resident Space Objects Using the P-Band Mono-Beam Receiver of the Sardinia Radio Telescope. Appl. Sci. 2019, 9, 4092. [Google Scholar] [CrossRef]
COMMENTS