Web-based Net Energy Meter for
Grid Connected PV System
Syafii Syafii, Muhammad Ilhamdi Rusydi, Lovely Son, Irvan Zikri
Electrical Engineering Department, Faculty of Engineering, Universitas Andalas, Padang, Indonesia
Abstract – The web-based PV system monitoring to
measure electrical production and consumption to the
load or utility grid is presented in this paper. This
monitoring system consists of an Arduino Mega 2560
with two PZEM 004T sensor modules. The monitoring
system has been designed to store measurement data of
current, voltage, power and energy in the database and
display on the webpage in real time and infographics
history. The PZEM sensor measurement has been
tested with an average power difference 0.29% less
than IEC-61724 minimum-accuracy. Realtime data is
obtained in the form of one-line data for every 2
seconds, with a data size of 375-byte and 75ms delivery
delay. For one day period testing, the electrical energy
that can be generated by the PV system is 5,925 kWh,
while the power consumed by the load is only 1,272
kWh so the accumulated electrical energy that can be
exported is 4.65 kWh. The test results show that the
system has been able to measure net energy export or
import by the PV system to utility grid.
Keywords – Web-based PV monitoring, Arduino
PZEM sensors, and Grid connected PV system.
1. Introduction
Increasing electricity demand affects in
diminishing energy reserves. Indonesia, with the
greatest potential for solar energy through the
government regulation No. 14, 2012 provides an
opportunity for owners to connect their PV Systems
into national utility network.
DOI: 10.18421/TEM91-06
https://doi.org/10.18421/TEM91-06
Corresponding author: Syafii Syafii,
Electrical Engineering Department, Universitas Andalas.
Email: syafii@eng.unand.ac.id
Received: 26 September 2019.
Revised: 24 December 2019.
Accepted: 06 January 2020.
Published: 28 February 2020.
© 2020 Syafii Syafii at al; published by
UIKTEN. This work is licensed under the Creative
Commons Attribution‐NonCommercial‐NoDerivs 3.0
License.
The article is published with Open Access at
www.temjournal.com
Utilization of PV system in distribution network
requires bidirectional power meter to evaluate the
amount of electrical energy produced and the burden
used to reduce electricity bill. Therefore, the
utilization of communication technology, sensors,
and information to distributed generation metering
and control are the topics of interest in the
development of future smart grid [1],[2].
Several previous studies have discussed various
techniques for electrical energy production and
consumption monitoring. The research on integrated
data-acquisition system for photovoltaic blocks
mutualization monitoring using LabView [3], remote
monitoring system based on GSM data
communication network for rural areas [4], LoRa
wireless sensor networks [5],[6] and web-based
through internet networks [7],[8], have been done
and reported. In a study conducted in [9], a Web-
Scada was implemented to monitor and control solarwind
hybrid generator systems remotely through the
internet and based on LabView software via RS232
serial communication [10]. The connection to the
internet network is done through a server computer
with communication between sensors, remote
terminals, and the server computers in the study use
serial communication wired networks and Local Area
Networks.
This paper presents the proposed web-based net
energy meter system using two PZEM 004T modules
based on Arduino microcontroller. The monitoring
system is designed in real time measurement and
record in historical online data. So that the data
obtained can be monitored anytime anywhere and
saved for further analysis. The electrical data from
the power produced by the PV system and the power
used in the load demand with the utility grid are
obtained through PZEM 004T sensors measurements.
The results of this study are expected to help obtain
the use of electrical energy and energy generated by
PV system in real time and historical online data,
displayed on websites that can be accessed anytime
and anywhere, so as to optimize the use of electrical
energy to be more efficient.
TEM Journal. Volume 9, Issue 1, Pages 37‐41, ISSN 2217‐8309, DOI: 10.18421/TEM91‐06, February 2020.
TEM Journal – Volume 9 / Number 1 / 2020. 39
system components consist of two parts, namely
testing with hardware and testing with software. The
system hardware is tested based on the installation of
Arduino Mega 2560 and PZEM 004T pins or cables
that are following the design. The system software
tested using Arduino IDE and Google Chrome
Developer Tools. The Arduino program tested using
Arduino IDE using monitor serial output parameters,
while on servers and clients it is tested using Google
Chrome Developer Tools software with output
parameters on the network.
The overall system is designed as shown in Fig. 2
below.
Figure 2. Web-based Net Energy Meter Real Circuit
4. Result and Discussion
The PZEM 004T test used to determine the sensor
configuration system with the Arduino Mega 2560
microcontroller. This aim has been achieved. The
operation of the sensor required four TTL cables
consisting of one 5V voltage operating cable, one
ground cable, and a pair of cables that function as
senders (TX) and data receivers (RX) with serial
communication lines as shown in Fig. 3.
Figure 3. Schematic diagram of PZEM 004T
Hardware testing is carried out by installing cables
directly through GND, TX, RX, and VCC pins on
pins that are available on Arduino Mega 2560.
Installation of two or more PZEM 004T requires a
project board to connect in parallel between VCC
pins and GND. The PZEM Pin connection is shown
in Table 1.
PZEM 004T (1) is installed in Arduino Mega 2560
Serial 2, and PZEM 004T (2) is installed in Arduino
Mega 2560 Serial 1 while VCC and GND on each
sensor are connected in parallel through the project
board. When the Grid tie inverter successfully
synchronizes with low voltage distribution grid, then
PZEM 004T (1) and (2) will directly transmit
voltage, current, power and energy data to Arduino
Mega 2560 as real digital values.
Table 1. PZEM Connection
Component Init
Pin Final Pin Note
PZEM 004T
(1)
VCC VCC on
project board 5 V
GND GND on
project board
negative polarity
of circuit
TX
Pin 17
Arduino (RX
Serial 2)
PZEM 004T (1)
Transceiver data to
Arduino
RX Pin 16 (TX
Serial 2)
Receiver data of
PZEM 004T (1)
from arduino
PZEM 004T
(2)
VCC VCC on
project board 5 V
GND GND on
project board
negative polarity
of circuit
TX Pin 19 (RX
Serial 1)
PZEM 004T (2)
Transceiver data to
Arduino
RX Pin 18 (TX
Serial 1)
Receiver data of
PZEM 004T (2)
from arduino
The PZEM 004T digital reading is done by the
serial communication with Arduino Mega 2560 to
get the amount of voltage, current, power and energy
as show in Fig. 4. By the comparison of PZEM 004T
measurement and Hioki 3286-20 Clamp Meter, can
be concluded that the PZEM 004T sensor (1) and (2)
have worked well because the measured value is
close to the measured value of Hioki 3286-20 Clamp
Meter with an average power difference of 0, 29%.
Based on IEC-61724 standard [11] this value is
acceptable because the accuracy is less than 1 %.
Therefore, data obtained from current, voltage,
power and energy of PZEM sensor can be used for
PV system monitoring.
Figure 4. Data read by PZEM 004T
Data obtained from each sensor will be stored in
the Arduino Mega 2560 program variable. The
TEM Journal. Volume 9, Issue 1, Pages 37‐41, ISSN 2217‐8309, DOI: 10.18421/TEM91‐06, February 2020.
TEM Journal – Volume 9 / Number 1 / 2020. 41
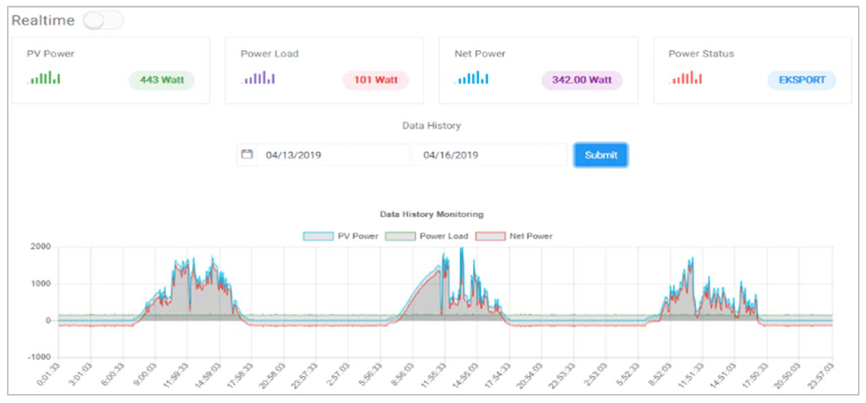
The accumulation of power collected for a certain
time will be calculated as energy. The measurement
results have been displayed in the form of
infographics to show the composition of energy use
and energy production as well as net energy in one
day period from 05/21/2019 to 05/22/2019 as shown
in Fig. 6. For one day measurement the energy that
can be generated by the PV system is 5,925 kWh,
while the power consumed by the load is only 1,272
kWh, so the accumulated electrical energy that can
be exported is 4.65 kWh.
5. Conclusion
The net energy meter system has read voltage,
current, power and energy generated at the inverter
output terminal and load terminal using the PZEM
004T sensors. Based on these data the net energy
export to utility or import from utility can be
determined. This system is equipped with a data
logger feature, so the measurement data can be
directly recorded on the client computer. The PZEM
004T obtained data have a good level of accuracy
with an average power difference of 0.29% compared
with Hioki 3286-20 clamp meter. For one day
measurement the energy that can be generated by the
PV system is 5,925 kWh, while the power consumed
by the load is only 1,272 kWh so the accumulated
electrical energy that can be exported is 4.65 kWh.
Based on these data, further investigation to calculate
the energy costs per kWh produced by a solar power
plant, saving the electrical energy obtained and the
length of investment costs return time achieved can
be performed.
Acknowledgements
The authors gratefully acknowledge the assistance
rendered by Directorate General of Higher Education and
Universitas Andalas for the research and publication
financial support.
References
[1]. Sharma, K., & Saini, L. M. (2017). Power-line
communications for smart grid: Progress, challenges,
opportunities and status. Renewable and Sustainable
Energy Reviews, 67, 704-751.
[2]. Labib, L., Billah, M., Rana, G. S. M., Sadat, M. N.,
Kibria, M. G., & Islam, M. R. (2017). Design and
implementation of low-cost universal smart energy
meter with demand side load management. IET
Generation, Transmission & Distribution, 11(16),
3938-3945.
[3]. Mezouari, A., Mateur, K., Alareqi, M., Hlou, L., &
Elgouri, R. (2017, April). Development of an
integrated data-acquisition system for photovoltaic
blocks mutualization monitoring using LABVIEW.
In 2017 International Conference on Wireless
Technologies, Embedded and Intelligent Systems
(WITS) (pp. 1-4). IEEE.
[4]. Tejwani, R., Kumar, G., & Solanki, C. S. (2016).
Remote monitoring of solar PV system for rural areas
using GSM, VF & FV converters. Journal of
Instrumentation, 11(05), P05001.
[5]. Shuda, J. E., Rix, A. J., & Booysen, M. J. (2018,
June). Towards Module-Level Performance and
Health Monitoring of Solar PV Plants Using LoRa
Wireless Sensor Networks. In 2018 IEEE PES/IAS
PowerAfrica (pp. 172-177). IEEE.
[6]. Paredes-Parra, J. M., García-Sánchez, A. J., Mateo-
Aroca, A., & Molina-García, Á. (2019). An
alternative Internet-of-Things solution based on
LoRa for PV power plants: data monitoring and
management. Energies, 12(5), 881.
[7]. Kopacz, C., Spataru, S., Sera, D., & Kerekes, T.
(2014, May). Remote and centralized monitoring of
PV power plants. In 2014 International Conference
on Optimization of Electrical and Electronic
Equipment (OPTIM) (pp. 721-728). IEEE.
[8]. Saraiva, L., Alcaso, A., Vieira, P., Ramos, C. F., &
Cardoso, A. M. (2016). Development of a cloudbased
system for remote monitoring of a PVT
panel. Open Engineering, 6(1), 291-297.
[9]. Soetedjo, A., Nakhoda, Y. I., & Lomi, A. (2014).
Web-SCADA for monitoring and controlling hybrid
Wind-PV power system. Telkomnika, 12(2), 305-314.
[10]. Anwari, M., Dom, M. M., & Rashid, M. I. M. (2011).
Small scale PV monitoring system software
design. Energy Procedia, 12, 586-592.
[11]. IE Commission. (2017). Photovoltaic system
performance monitoring-guidelines for measurement,
data exchange and analysis–Part 1: monitoring. Int.
Stand. IEC, 1-10.
[12]. Miškuf, M., Kajáti, E., & Zolotová, I. (2017). Smart
metering IoT solution based on NodeMCU for more
accurate energy consumption analysis. International
Journal of Internet of Things and Web Services, 2,
115-121.
[13]. Pereira, R. I., Dupont, I. M., Carvalho, P. C., & Jucá,
S. C. (2018). IoT embedded linux system based on
Raspberry Pi applied to real-time cloud monitoring of
a decentralized photovoltaic
plant. Measurement, 114, 286-297.
COMMENTS