INTRODUCTION
Currently, solar and wind farms with an installed capacity of 227.3 and 87 MW, respectively, covering more than 5% of the electricity demand have already been built in Crimea. In the Russian Federation, the development of photovoltaics is still small in comparison with the indicators of the leading industrial countries [3, 4]. The wider introduction of solar power plants is hampered by several reasons, the main of which are high cost, low efficiency, and imperfect energy storage technologies. Specialists from various countries, including Russia, are continuing to work to reduce the impact of the above factors. Great contributions have been made by J.I. Alferov, D.S. Strebkov, G. Rauschenbach, A.P. Landsman, V.V. Elistratov, and V.A. Mayorov, among others. It should be noted that not only do photovoltaic modules need to be improved, but also all the auxiliary plant components—converting devices, supporting structures, energy storage systems, and many others—that significantly affect its cost in general. When conducting research at the Sevastopol Solar Power Plant (S. Energy-Sevastopol), a problem was detected since some of the photovoltaic groups were disconnected and, as a result, did not transmit electricity to the network. The causes of this phenomenon were the failure of part of fuses installed in the marshalling boxes, partial shadowing of the photovoltaic modules, broken connecting wires, and a factory defect in the MC4 connectors. Moreover, each of these led to the shutdown of not one photovoltaic panel, but the entire series-connected group consisting of 18 panels. The problem was also exacerbated by the fact that the maintenance personnel did not have the ability to quickly detect these faults due to the large number of panel groups (about 550) and the lack of special diagnostic tools. This requires arrangement of remote monitoring of the solar power plant operation, providing control of operability of the photovoltaic panel groups, as well as the analysis of the main electrical parameters.
MATERIALS AND METHODS
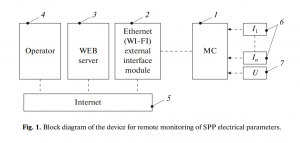
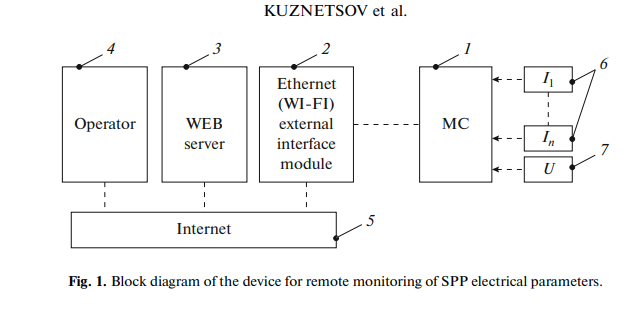
Figure 1 shows a block diagram of the device for remote monitoring of the SPP electrical parameters. The main computing element of the device is microcontroller 1, the input of which receives signals from current sensor 6 and voltage sensor 7, which measure the electrical parameters of the photoelectric converter batteries. To transfer data from the microcontroller to server 3, external interface module 2 is used. The server receives the data, records and processes them for convenient perception by operator 4, generates a signal, and transmits it to the microcontroller. Data transfer between the external interface module, the server, and the operator is carried out over the Internet.
RESULTS AND DISCUSSION
A comparative analysis showed that the most appropriate seems to be the application of ATmega 328p Atmel microcontrollers in the device. This is because such a controller has a built-in ten-digit analog-to-digital converter (ADC) and an expanded system of commands and peripherals, as well as a low price. This controller is installed on Arduino hardware platforms (Uno, Mini, etc.) that have the required set of elements wiring for integration with shields, as well as an integrated linear voltage regulator and a quartz resonator with a frequency of 16 MHz. In addition, the development of software for the controller using the Arduino platform can be done in the Arduino IDE free development environment, which contains many libraries simplifying the external device operation.
To control the photovoltaic battery operation and current measurement, an integrated current Allegno ACS712 sensor was used. The advantages of this sensor are galvanic isolation between the power circuit and the controller, as well as an absence of temperature dependence. The principle of operation of the sensor is based on the Hall effect. A signal driver that is built into the microcircuit filters the voltage created by the sensitive element and amplifies it to a level sufficient for AD-encoding.
The choice of this sensor is also conditioned by the high accuracy of measurements. Calibration results show that the error is not more than 9 mA, which is significantly less than the data specified in the manual. Figure 2 shows the switching circuit and general view of the ACS712 current sensor. To improve the signal-to-noise ratio, there is an RC filter at the sensor output. ACS712 contains a built-in resistor accessible on the sixth microcircuit pin; therefore, only an external capacitor CF is switched on. The research showed that, to obtain the most optimal value, it is necessary to repeat the measurement cycle at least 500 times with finding the arithmetic mean value. The program code is as follows:
for (int i = 0; i < 500; i++) { // cycle repetition statement (500 times)
x = 0.0264*(analogRead(z)-510); // instantaneous current measurement
y += x; } // summation of instantaneous current measurements
I = y/500; // finding of arithmetical mean
lcd.print(I); // current value output
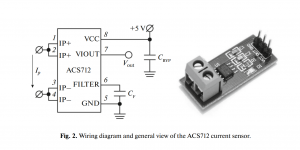
To control the voltage and determine the photovoltaic converters, the developed device includes a voltage sensor, the functional diagram of which is shown in Fig. 3. The sensor consists of two galvanically isolated circuits: a measuring circuit, consisting of limiting resistor R1, a transistor optocoupler LED, and a data one consisting of limiting resistor R2 and an optocoupler phototransistor. The principle of operation of the sensor is to convert the input voltage in the range from 0 to 800 V, into the corresponding output voltage satisfying the input parameters of the AD-encoder (from 0 to 5 V). Figure 4 shows a sensor output–input voltage diagram obtained as a result of the experimental study of its operation.
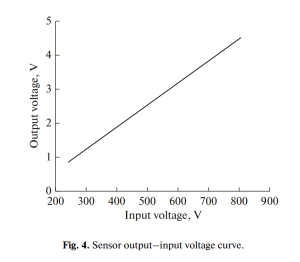
It can be seen from Fig. 4 that the output–input voltage dependency takes place according to a linear law described by the equation where Uout is the output sensor voltage, V, and Uin is the input (measured) sensor voltage, V. With allowance for the effective number of bits of the AD-controller, the program code for the sensor operation is as follows:
x = analogRead(z2); // instantaneous voltage measurement
U = (x + 149)/12.24; // finding of true value
delay (500); // pause of 0.5 s
lcd.print(x); // voltage value output
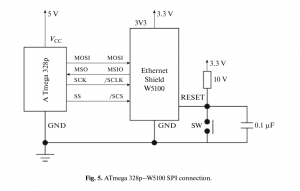
Data is transferred from the microcontroller to the server by sending a GET request containing the processed sensor parameters. This task is performed with a WIZnet controller W5100, which is an all-in-one 10/100 Ethernet controller. The hardware implementation of the TCP/IP protocol stack allows obtaining high data transfer rates of up to 25 Mbps and provides a simple connection to the Internet independently from operating systems and external computers.
To interact with the ATmega 328p microcontroller that receives signals from the sensors, it is advisable to use an Ethernet-shield assembled on the basis of the W5100 controller, since it has a ready-made set of elements wiring and simplifies software and physical microcontroller board switching. The controllers communicate through the SPI interface. The WIZnet W5100 acts as an SPI slave, while the ATmega 328p microcontroller acts as a master. Figure 5 shows a structural connection diagram.
Data is transferred to the WEB server with different frequency. This is necessary to reduce the MySQL database size. Voltage and current values are transferred with a frequency of 1 min, and power values are transferred every hour. Electric power supply to all circuit elements was carried out by means of a dc–dc buck converter. An APT45GP120 IGBT transistor was used as the main key element. The developed converter reduces the voltage from 550–700 to 9 V and stabilizes it.
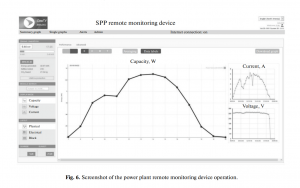
To illustrate the device’s operation, Fig. 6 shows a screenshot of the browser window, which displays data from the WEB server received from the developed remote monitoring device. The presented data display information on the daily power of the operating SPP measured every hour, as well as the voltage and current. Due to the fact that the measured electrical parameters are displayed in a convenient graphical form, the system allows not only monitoring them, but to receive recommendations on optimizing particular plant sections, such as setting the optimal tilt angle, eliminating partial shadowing (or minimizing its effect), using various photovoltaic switching options, and using additional ways to increase efficiency.
CONCLUSIONS
The device that has been developed allows continuous monitoring of the photovoltaic converter with long-term storage of the measured data in graphical form, which makes it possible to visually analyze the SPP operation, monitor its performance, compare key performance indicators for different sections, receive reports on electricity production by periods with plotting of curves, and receive alarm signals. This device has good stability and an easy setup for various operating objectives.
COMMENTS