INTRODUCTION
Tropical rainfall intensities can vary significantly, even over sub-kilometer distances. This spatial localization is significant, because wireless spatial diversity schemes for high bandwidth high frequency communications are engineered over such scales; and over such distances, a waterlogged sloped on the brink of a landslide may require a system to provide an alarm or warning. To get precipitation data at sub-kilometer resolutions, a high-density deployment of rainfall sensors, such as tipping buckets or remote weather stations, is required. However, in developing countries such as the Philippines, which are at risk of rain-induced disasters, more cost-effective equipment must be developed. Acoustic sensors have been used in previous studies as point sensors for rainfall. The sound produced by the impact of raindrops on the sensor surface provides information about the rain event. Higher levels of rainfall sounds have been shown to correspond to higher rain rates. Acoustic point sensors can be deployed in high densities to gather rainfall data at higher spatial resolutions. Such deployments can show the variations of rainfall intensities in sub-kilometer areas. Because acoustic sensors have no mechanical moving parts, they can be made at lower cost, are more robust, and can potentially be deployed at higher densities. Previous works have yielded proof of concept measurements from acoustic sensors deployed in a rain field. However, the sensors were not equipped with telemetry capability, and acoustic power data was retrieved manually. This study is about an acoustic sensor designs with remote measurement capability, which is centered on low-cost Android-based mobile devices, and alternative acoustic sensor open hardware platforms such as the Arduino.
DESIGN AND DEVELOPMENT OF ACOUSTIC SENSORS
Android-based Integrated Sensor Design:
Android-based mobile devices are used as point acoustic sensors for rainfall. The advantages of using an Android based device as a sensor are that the Android software development kit (SDK) provides access to information gathered by the device’s sensors (e.g., microphone), the device’s connectivity features can be used (e.g., Wi-Fi, 3G, and GSM), and Android devices are low-cost compared to commercial weather stations. The processing capacity of Android-based devices allows the pre-processing of data in the phone and eliminates the need for other hardware to process the data. With the SDK, the program can be customized to enable the Android-based sensor to handle various tasks. For this work, a simple, 133 KB software was developed, and the Android device was programmed to be a sensor that gathers rainfall data, a processor of the gathered data that controls an SMS alarm, and a field server that transmits the gathered data to a web server for remote data access. With these functions, the Android-based sensor can act as a low-cost weather station that can easily be deployed at high densities to monitor rainfall.
Acoustic sensing is just one of the functions available in Android-based sensors. The Android-based sensor was also programmed to measure the effects of rainfall on the received signal levels from Wi-Fi routers and GSM base stations, captures images of the rain event for image processing, and logs accumulated rain from a tipping bucket interfaced using an Arduino board. Proof of concept measurements from the novel integrated Android-based sensor have been presented in a previous work.
To record the sound of the rainfall, the microphones of the Android devices are used as inputs. A software is developed that uses the audio Record class of the Android platform is to “pull” raw audio data from the microphone at a frequency of 11,025 Hz. The raw audio data are encoded and written into a 16-bit pulse-code modulation (PCM) file, which is stored in the mobile device’s 2 GB external micro-SD memory card. While the PCM file is written, the calculate Power function is used to calculate the acoustic signal power (dB) from the raw audio data. The acoustic signal power is calculated once every five seconds and is output into a comma separated value (CSV) file, which is stored in the mini-SD card.
The software requires a Time Interval input in minutes, which controls the length of the recorded PCM and CSV files. For example, if the Time Interval is set to 10 minutes, the acoustic sensor records raw audio and acoustic signal power for 10 minutes. The PCM and CSV files are then stored in the mini-SD card, and the sensor uploads the files to a web server through an HTTP connection. The sensor then creates new PCM and CSV files, and records for another 10 minutes. The data gathering cycle can be stopped manually or by sending SMS command keywords to the sensor. The software has a function that uploads the gathered acoustic signal power data to a web server after each time interval when a Wi-Fi or 3G network is available. A computer terminal is used to access the gathered data. This feature is being integrated with a web user interface, which enables users to access the data gathered by the Android-based acoustic sensors.
Previous studies have presented designs for rainfall alarms that can be used for disaster management. The software of the Android-based sensor has an SMS alarm function. Before the Android-based acoustic sensors are deployed, thresholds can be set for the measured acoustic signal power. At the end of each time interval, the software calculates if the measured acoustic signal power exceeds the threshold. If the threshold is exceeded, an SMS message is sent to a selected recipient.
Arduino-based Sensor Design:
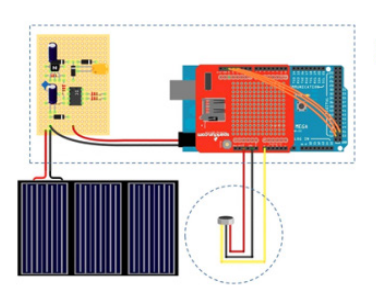
An acoustic sensor, based on the Arduino platform, is also designed. The prototype sensor gathers rain rate and RMS voltages from rainfall. The sensor is composed of an Arduino board with a mounted WIZnet W5100 Ethernet Shield, which connects to a network for remote data access; an uninterruptible solar power supply, which has three 5 V, 5 W solar panels with a maximum regulated output of 12 V; and a 1.85 L tin housing, which encloses the input electret microphone and soundproofing materials. The solar power supply charges two 9 V batteries to power the Arduino board under low-light conditions and at night.
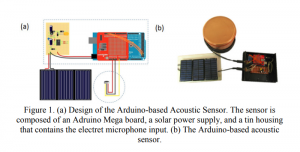
Figure 1 (a) shows the design of the Arduino-based acoustic sensor. The dotted rectangle represents a plastic housing that contains the regulator circuit, batteries, and the Arduino board; and the dotted circle represents the tin housing for the microphone. The Arduino-based sensor measures the voltage, produced by the vibrations in the electret microphone, and calculates the acoustic signal power. The minimum voltage value is 0 V, and the maximum is 5 V. The sensor logs the voltage or acoustic signal power data in a CSV file. The CSV file is written in the mounted micro-SD card. Using the mounted WIZnet W5100 Ethernet Shield connected to a router, data files can be sent to a server, and a computer terminal in the network can view the data. For future works, the WIZnet W5100 Ethernet Shield can be replaced with a Wi-Fi shield for wireless data access.
FIELD TESTING
Data Gathering Using Android-based Sensors:
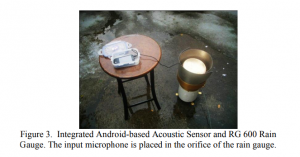
Initial experiments were conducted to test the performance of the Android-based acoustic rainfall sensor. The microphone of the sensor was placed inside a 1.85 L tin housing. Soundproofing material was placed inside the tin housing to minimize ambient noise. The Time Interval was set to five minutes in experiments. The mobile device was placed inside a waterproof container. During rain events, the setup was deployed in an open area. The sensor recorded the PCM and CSV files that contain the raw audio and acoustic signal power data, respectively. After the rain event, the sensors were retrieved, and the output PCM and CSV files were consolidated and graphed.
Integrated Android-based Acoustic Sensor and Tipping Bucket:
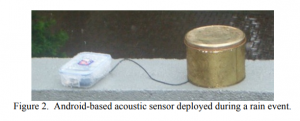
Experiments were also conducted to compare the rain rate, derived from the accumulated rain gathered by a 0.2 mm tipping bucket rain gauge (Casella CEL Tipping Bucket Rain Gauge™), and the acoustic data of rainfall gathered by the Android-based acoustic rainfall sensor. To compare the acoustic data and rain rate, the acoustic signal power generated by rain drops in the orifice of the tipping bucket rain gauge was recorded by placing the Android-based sensor inside the tipping bucket. The setup was sealed and deployed during rain events.
After rain events, the rain gauge and Android sensor were retrieved. The rain rate (mm/hr.) was obtained by calculating the differential of the accumulated rain, with respect to time t in minutes. The rain rate and acoustic signal power are then graphed. Acoustic signal power was also compared with accumulated rain from a Global Waters RG 600™ tipping bucket. The input microphone of the Android-based sensor was placed in the orifice of the tipping bucket as shown in Figure 3. This integration shows the advantages of using the Android-based acoustic sensor. The acoustic signal power provides near real-time data of rain. Unlike the tipping bucket, which gathers accumulated rain data at 1-minute intervals, the Android-based sensor records real-time rain data.
Simultaneous deployment of Android-based Acoustic Sensors during Rain Events:
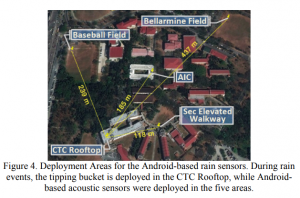
Experiments were also conducted with simultaneous, multiple deployments of Android-based acoustic sensors to measure the spatial variations of rain. The deployment areas and their respective distances to the tipping bucket are shown in Figure 4. During rain events, Android-based acoustic sensors were deployed in five areas inside a sub-km2 area.
Initial Calibrations and Baseline Measurements of the Android-based Acoustic Sensor:
Initial calibrations were performed between the android based acoustic sensors and a Radio ShackTM sound level meter. Sounds with frequencies ranging from 500 Hz to 10 KHz were played at different sound levels and at distances of 30 cm and 60 cm from the Android-based acoustic sensor. The Android-based sensors were also used to obtain an acoustic signal power baseline in the different deployment areas. This baseline was used to eliminate the effects of ambient noise on the rainfall measurements. To obtain the baseline, the Android-based sensors were deployed in the areas shown in Figure 4. The sensors measured the acoustic signal power, without rain. The measurements were averaged, and the obtained values were used as the baselines for their respective areas. When measurements were taken during rain events, any acoustic signal power value that fell below the baselines were filtered out, while values that exceeded the baselines were taken as data.
Data Gathering Using the Arduino-based Sensor:
Rainfall was simulated to test the Arduino-based sensor. The sampling rate of the sensor was set to 10 Hz. Water was sprinkled on the Arduino-based sensor at 30-second durations. The acoustic signal power values of the impacts of the water droplets were logged. The Arduino-based acoustic sensor was also used to measure a voltage baseline. The baseline indicates the voltage produced by ambient noise, without rain, in the deployment areas, and the voltage offset of the sensor. The baseline was measured by deploying the Arduino-based acoustic sensors in events without rain. The sensor measures the ambient noise for 30 seconds. Readings that fell below the ambient noise level were filtered out.
The acoustic power baseline indicated the ambient noise in the deployment areas. The baseline can be used as an offset for the acoustic signal power. Any acoustic signal power measurement above the baseline was taken as data, while anything below was filtered out.
Arduino Baseline Measurements:
Experiments were also conducted to compare the voltage measurements of the Arduino-based sensor with the acoustic signal power measurements of the Android-based sensor. The input microphones of the two sensors were placed inside the same tin housing, and simulated rain was poured for 1 minute. The voltage data from the Arduino-based sensor and the acoustic signal power data from the Android-based sensor were graphed and compared.
RESULTS AND DISCUSSION
Initial Data from the Android-based Acoustic Sensor:
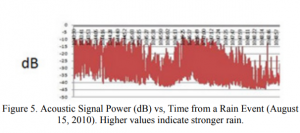
Acoustic signal power results from the Initial Experiment, conducted during the rain event on August 15, 2010, is shown in Figure 5. Results indicate that the recorded acoustic signal power values vary as the rain event goes on. Based on previous studies, higher acoustic signal power values indicate higher rain rates, and lower acoustic signal power values indicate lower rain rates. The Initial Experiments show the feasibility of Android-based devices to record acoustic rainfall data. The Android-based device can record the raw data and calculate the acoustic signal power directly. The Android-based sensors produce comparable data with the acoustic sensors used in previous studies.
The sensor calculates the acoustic signal power from the PCM file and stores it in a CSV file. This feature minimizes the required memory to store rainfall data because the file size of a CSV is one fifth of its corresponding raw PCM file. In Figure 5, rain produced sounds with acoustic signal powers ranging from approximately -44 dB to -6 db. The range of values shows how the sensor detects the variations in the sound of the rainfall.
Comparison of Acoustic Signal Power from the Android-based sensor and Rain Rates from Tipping Buckets:
The acoustic data are compared with rain rate data gathered the Casella CEL Tipping Bucket Rain GaugeTM. Figures 6 (a), (b), and (c) show the acoustic signal power, 3- minute rain rate (t = 3), and 1-minute rain rate (t = 1), respectively, from the 30-minute rain event on September 15, 2010.
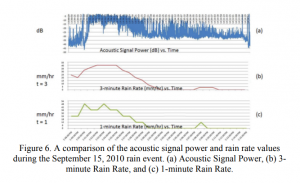
As the rain rate increases, the acoustic signal power also increases. When the rain rate is low (i.e. 0 mm/hr), the acoustic signal power is also low (approximately -30 dB). The results also show the advantages of using the Android-based acoustic sensor. The acoustic signal power provides near real-time data of rain. Unlike the tipping bucket, which gathers accumulated rain data at 1-minute intervals, the Android-based sensor records real-time rain data.
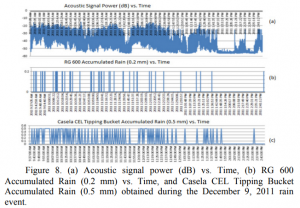
Moreover, the tipping bucket rain gauge, being an accumulation gauge, only outputs data if the accumulated rainfall is enough to tip the bucket (0.2 mm), while the Android-based acoustic sensor measures the acoustic signal power continuously. Figure 5 shows that the acoustic signal power peaks up to -10 dB even when the rain rate from the tipping bucket is 0 mm/hr. If only the data from the tipping bucket is considered, one might assume that the rain event has stopped when the rain rate is at 0 mm/hr. The audio signal values in Figure 5 (c) when the rain rate was 0 mm/hr indicate that the rain event was still ongoing, but the accumulated rainfall was not enough to tip the bucket of the rain gauge. Figures 7 (a) and (b) show rain data gathered by the Android-based acoustic sensor and the RG 600 Tipping bucket for the December 9, 2011 rain event. The acoustic sensor is placed in the orifice of the RG 600 Tipping bucket. The peaks in Figure 7 (b) indicate the tips of the RG 600 Tipping bucket (0.2 mm). Figure 7 (c) shows the tips (0.5 mm) of the Casella CEL Tipping Bucket for the same rain event for comparison.
Similar to the results in Figure 6, the Android-based acoustic sensor provides real-time data while the two tipping buckets provide accumulated rain data in mm. From 9:37 AM to 1:36 PM, the RG 600 measures the accumulated rain, indicated by the discrete tips. In the same time period, the Android-based acoustic sensor measures the changes in acoustic signal power caused by the changes in rain rate. Even at times when the RG 600 is not tipping (i.e. 0 mm), the Android-based acoustic sensor still logs acoustic signal power values, which indicates that the rain event is still ongoing.
Such cross-measurements show that acoustic sensors, which are low-cost compared to commercial weather stations, can be easily deployed at high densities over an area, and can provide similar, if not richer, data as tipping buckets. Further studies are being performed to obtain a correlation between acoustic signal power and rain rate.
Simultaneous Deployment of Multiple Android-based Acoustic Sensors:
To measure the spatial variations of rain within a sub-km2 area, multiple Android-based acoustic sensors were deployed at different locations (Figure 4). The Android-based acoustic sensors measured the acoustic signal power, while a tipping bucket measures the accumulated rain (mm). Figures 9 to 12 show four sets of acoustic signal power data from different deployment locations shown in Figure 4 (SEC Elev. Walkway, CTC Roof deck, AIC, and the Bellarmine Field), and the accumulated rain obtained by a tipping bucket rain gauge during the rain event on October 5, 2011.
The figures show the acoustic signal power values measured from three locations within a sub-km2 area. In the four graphs, a single tipping bucket rain gauge in the CTC Roof deck measures the accumulated rain. The highest accumulated rain peaks, of 1 mm, are obtained between 1:59 PM and 2:17 PM. At these times the acoustic signal power values were highest at approximately – 2, -16, -22, and -14 dB in the SEC Elev. Walkway, CTC Roof deck, AIC, and Bellarmine field, respectively.
When the accumulated rain is 0 mm (between 1:30 PM and 1:52 PM), the acoustic signal power values in the 4 locations were also low, at approximately -34, -60, -65, and – 59 dB in the SEC Elev. Walkway, CTC Roof deck, AIC, and Bellarmine field, respectively.
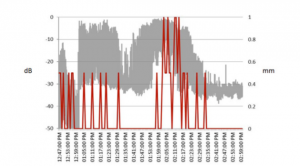
Figure 9. Acoustic signal power (dB, grey) and Accumulated Rain (mm, red) versus Time obtained at SEC Elev. Walkway on October 5, 2011.
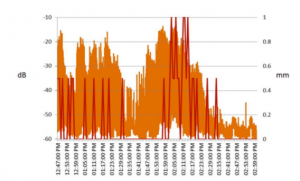
Figure 10. Acoustic signal power (dB, orange) and Accumulated Rain (mm, red) versus Time obtained at the CTC Roofdeck on October 5, 2011.
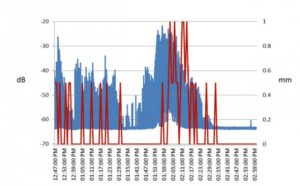
Figure 11. Acoustic signal power (dB, blue) and Accumulated Rain (mm, red) versus Time obtained in AIC on October 5, 2011.
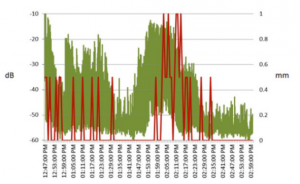
Figure 12. Acoustic signal power (dB, green) and Accumulated Rain (mm, red) versus Time obtained in Bellarmine Field on October 5, 2011.
Acoustic Signal Power Baseline:
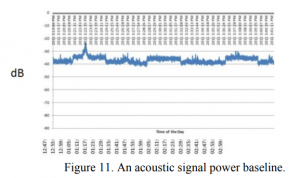
Acoustic signal power baselines were obtained using the Android-based sensor by recording the ambient sounds, without rain, in the six deployment areas. Figure 11 shows an acoustic power baseline. Without rain, the measured ranges from approximately -40 dB to -35 dB. Baseline values vary based on the noise level at the deployment location.
Data Upload and SMS Alarm:
Android-based devices have connectivity (Wi-Fi and 3G) and SMS capabilities. The software uses these capabilities to upload the gathered acoustic signal power data to a web server, and to send SMS alarms to user-set recipients (i.e., disaster managers). These features allow Android-based sensors to function like remote weather stations that gather, store, and transmit rainfall data.
The software requires three inputs to trigger data upload and the SMS alarm: a Time Interval (in minutes), an Acoustic Signal Power Threshold (in dB), and a Tolerance (a percentage from 0% to 100%). The Time Interval triggers the data upload function. When data gathering begins, the Android-based sensor logs acoustic signal power values in a CSV file, until the set Time Interval elapses. At the end of the Time Interval, the CSV file is written on the micro-SD memory card, and the sensor creates a new CSV file, which will contain the data gathered for another Time Interval. When a CSV file is written, the software calls the doFileUpload function, and posts the written file on a webserver. This allows users to download and the files using terminals that can access the web server and makes data gathering more efficient.
The Time Interval, Threshold, and Tolerance trigger the SMS Alarm. During every Time Interval, the software counts the total number of acoustic signal power values that were logged (totaldata), and the number of the values that exceeded the Threshold (cntdata).
At the end of a Time Interval, if (cntdata/totaldata) × 100% ≥ Tolerance, the Android-based sensor sends an SMS alarm to a user-set recipient. The simple alarm algorithm can be improved and is a recommended subject for future works.
Arduino-based Rain Sensor:
The obtained baseline from the Arduino-based sensor was 2.5 volts, as shown in Figure 12. The Arduino-based sensor had an offset of 2.5 volts. Softer sounds produce voltages near 2.5 V, while louder sounds produce voltages near 0 V or 5 V, which are the minimum and maximum output voltages, respectively. The Arduino was programmed such that voltage readings below 2.5 volts are filtered out, and only voltage readings that are at least 2.5 volts are logged.
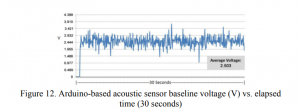
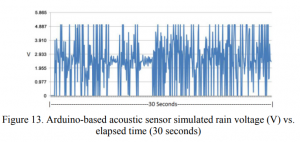
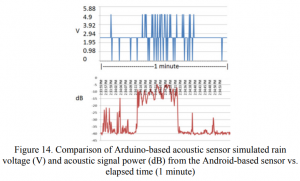
Figure 13 shows a voltage data set from a 30-second simulated rain event, which has not been filtered based on the 2.5 V baseline. Simulated rain drops that had softer sounds produced voltages near 2.5 V, while those with louder sounds produced voltages near 0 V and 5 V. Figure 14 shows the comparison of voltage measurements from the Arduino-based sensor and the acoustic signal power measurements from the Android-based sensor. Voltage peaks (relative to the 2.5 V offset) of 5 V and 0 V correspond with higher acoustic signal power values (-10 dB to -5 dB).
Results from initial tests show that the Arduino-based sensor is prone to saturation. Simulated rainfall with acoustic signal power values ranging from -10 dB to -5 dB cause the Arduino-based sensor to output the maximum and minimum voltages (5 V and 0 V, respectively), which affects the sensitivity of the sensor to louder sounds. The fast saturation of the Arduino-based sensor is a problem for study in future research.
CONCLUSIONS
In this study, the designs of Android- and Arduino-based acoustic sensors are presented. The sensors are used to gather acoustic signal power from rain events. The acoustic signal power values have a positive correspondence with tipping bucket rain rate measurements. The Android-based acoustic sensors have data upload and SMS alarm functions that can be used for disaster management. The use of acoustic sensors is a novel method for monitoring rain, and complements tipping bucket rain gauge measurements. Aside from rainfall monitoring capabilities the Android-based rainfall sensor includes functions for wireless data transmission and a SMS alarm system that can be used for disaster management applications. The novel acoustic sensors can be deployed at high densities within sub-km2 areas to measure the spatial variations of tropical rain. Moreover, because the system is based on customizable platforms such as Android and Arduino, it can be used for other sensing applications that require telemetry.
COMMENTS