components
Hardware Components
Arduino ethernet shield
X 1
Arduino MEGA
X 1
Sensor Thermocouple MAX6675 Type-K
X 1
Iot Sensor
X 1
Data Logger
X 1
details
I. INTRODUCTION
Needs technology which the more advanced demanding development system monitoring on something indicator, salah the only one is temis carried out temperature. Temperature or be bought is something quantity which shows scourgejat hot inwant itri something. There’s a differenceand the degree of solar heating in surfaceearth, menyebabkansomethingarea andan have temperature difference with kaother wasan. Parthot that until the surface earth absorbed and part lagi reflected. Articlelan ray mhe will die the will very affect temperature in the area these [1]. temperature suhu Becomes indicator which very pemaybein something research which require use the temperature stable. Measurement temperature regularlyneed conducted to get data temperature change every few minutes. Dor result pengsize can be stored and can be observed in the form of a graph. Either onesensor yang canusedto measure temperature
is a thermoco sensoruple type-K. Development technology fromwas Indrusty 4.0 mebe wrong one acuan in the making a plan tool when this. Technology that bgrowing in it is wrongone is
Internet of Things (IoT). IoT will facilitate sea person in monitoring suone thing because it can be accessed online realtime . IoT isa systemwhere is the computing machine,tool mechanical nor digital, man, animal, alwayspun object certain, which connected and could berettraction through internet. This system has the capabilityan to transfer data through network internet without requiren interaction human – humans, or humans– computers [3]. This IoT use requires an Ethernet Shield module W5100. Ethernet Shield isdeviceadditional yThe used for connect Arduino into networkn computer or internet. Ethernet Shield W5100 supports until ewrong connection socket regularly telephonelt. Progrgenerally enoughwithconnect Arduino with computerr via USB as well asconnect you EthernetShield dno onecomputer or routers,can use UTP Cat5 with connector RJ54 [4].
II. METHODS
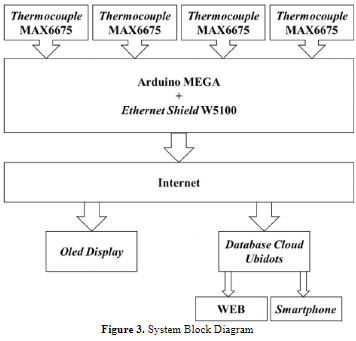
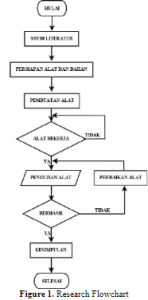
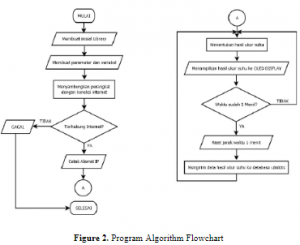
Method to be used pthere is this research is which first with planning theskeleton work, where The framework will briefly describe the sequence willheld. FlowchartResearch Methods can
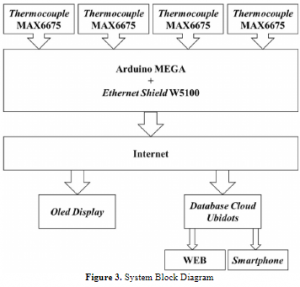
seen in Figure while the diagramprogram flow algorithm shown in picture 2 Block diagramm system on rancThe wake up dapat seen onpicture3. Planwoke upi consistof four buah sensor thermocouple MAX6675, Arduino microcontroller Mega, Ethernet Shield W5100, Oled Display, dan andtabase cloud Ubidots. Sistem it will be supplied by voltage 7-12 VDC.
III. RESULTS AND DISCUSSION N
A. Database Cloud pada Ubidots Ubidots selected because noeasier managed for user. Ubidots could accessed use WEB or use the appng is already available ini Google Play Store. Be foundmenu devices, dashboard, events, and setting. Device is menu which containing device which connected by cloud databaseUbidots. Dashboard is menuwhichwillshowing widget which could disesusending with need.This Dashboard will mengtake Whicha from device and will be displayed on the associated widget . Appearance User Interface Ubidots dapat seen on gambar 4 andon figure
B. Design Results E Electronics and Hardware Design
Plan get up this made with stages making plan electronics berupa diagram surveillance and then made dsay for manufacturinghardware of tools this. wiring diagramon system ini divided into three part namely the wiring diagram of the Oled Displiscould seen on picture 6, diagram penthe body sensor thermocouple MAX6675 could seen on picture 7, and isgram control switch cant seen in picture 8
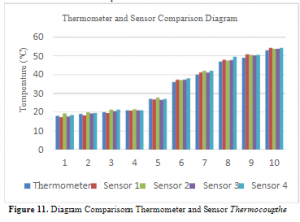
C. Tool Calibration Test
Test calibration tool this conducted for knowing level he is oldthe from sensor withtoolmeasuringwhich already conventional like thermometer air mercury. Process this calibration conductedof temperature18℃-53℃. Measurement resultbetween sensor with thethe thermometer will right?send and obtained difference value. Resultsmeasure fromsensors and thermometerscan be seen on table 3. Difference in results gaugean between termometer and sensors can be seen in the table4.
E. Measurement of Pe Rate heat transfer
Speed measurement perepair ifr use method conduction. Method kunfortunately this is methode which use media intermediary in the form of wire bethe restmeter 2 mm and copper wire with a diameter of 1.5 mm. examinern this performed withhow to linkone of ujung from the wire with a heat source coming from the solder, then each sensor installed with distance 2.5 cm. Methodmeasurement this couldseenon gwarehouse16 and gwarehouse 17. Results testing shown in shape chart which shown on picture 18 and picture 19.
IV. CONCLUSION
Based on the results of researchersand can be concluded:
1. Results which obtained from study this is palacet monitoring temperature on suathat place or on an object
COMMENTS