
I. INTRODUCTION
Water scarcity is a major challenge around the globe [1]. The United Nations 2015 report on world water development highlighted limitation of clean and safe drinking water as a major issue across Europe and North America, Asia and the Pacific, the Arab region, Latin America and the Caribbean, and Africa [1]. The United Nations Department of Economic and Social Affairs [UNDESA] report published in 2013 states that water crisis is not only a natural but also a human-made phenomenon [6]. Physical scarcity has resulted from natural phenomenon, that is; climate change and global warming whereas people’s inability to utilize adequate water sources has resulted from economic scarcity which is common among low income earners in developed countries and more prevalent in under developed communities, especially in Africa [2].
II. RELATED WORK
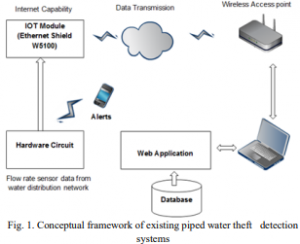
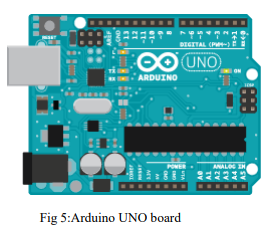
Significant number of research initiatives has been undertaken in response to water theft challenges that face water distribution companies around the globe. To the best of our knowledge, till to-date, no work has been done on application of Machine Learning Predictive Models in piped water theft detection. The authors in [14] use Arduino for central processing interfaced with water flow rate sensors, solenoid valve and flow meter. The microcontroller captures water flow rate readings which are compared with the fixed set value of water flow. Any reading that deviates from the set norm value is regarded as theft. A mobile application called Cayenne is also proposed for prepaid water purchase. With the use of Ethernet Shield W5100, data from the system can be uploaded to the application. This IOT module is dependent on the WizNet5100 Ethernet chip datasheet with a system IP stack for handling TCP and UDP packets [16].
III. MATERIALS AND METHODS
In this section, a thorough description of the proposed random forest classifier has been made followed by a discussion of the Benchmark models that is SVM, LR, and KNN.
A. Random Forest
RF is a statistical learning model which works well with small to medium data compared to Neural Network which require large training data [22]. Random Forests can be precisely defined as a combination of tree predictors in which each tree is dependent on values of an independently sampled random vector whose distribution is same for all the trees within the forest.
B. Benchmark Methods
i) Support Vector Machine Support Vector Machine (SVM) is a supervised learning model that performs classification by constructing hyperplane in a high dimensional space that maximizes the margin between classes [26].
V. PROJECT DESCRIPTION
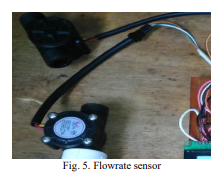
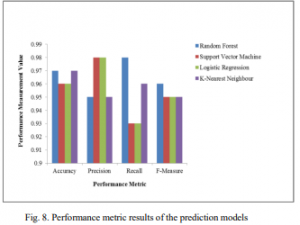
A circuit prototype was designed in proteus, with two Arduino microcontrollers designated as slave and master programmed and interfaced with flowrate sensors, GSM (Global System for Mobile Communication) modem, and LCD (Liquid Crystal Display). A brief description of these components is presented in the next section. Experimentation was done over a 3-hour period and water flow rate data collected in 10 seconds interval. This data was tabulated, preprocessed and analyzed. 80% of the data was used for training a Random Forest classifier and 20% was used for testing purposes. The model was evaluated on accuracy, precision, recall and F-measure. Training and Testing was also done on benchmark models that are SVM, LR and KNN and the resulting performance measurements were compared with the proposed model.
A. Design

i) Block Diagram
An experimental prototype was designed as shown in figure 2 and used for data collection. The system adopts a nominal value of flow rate after a delay of about 2 minutes. This is in line with the water supply mechanisms by water distribution companies which strives to supply water in a given pressure zone at a range of predefined pressures. Though some fluctuations may occur, the distribution pressure cannot fall above or below a certain value [32].
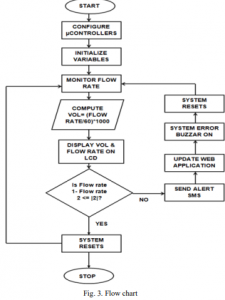
ii) Flow chart
The flow of events followed in operation of the prototype for data collection is as shown
B. Components Description
V. CIRCUIT DESIGN AND EXPERIMENTATION
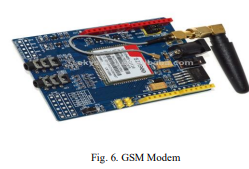
The water theft detection system was designed and simulated in proteus software with two Arduino Uno microcontrollers programmed as Master and Slave because every Arduino Uno can support a single flowrate sensor. The Master controls the entire circuit including the slave microcontroller which is instructed by the master. The GSM module was interfaced with the Master and uses serial communication to send sms alerts to a Mobile phone. The SMS states the flow rate along a given service line and the volume consumption at that instant.
VI. MODELING AND PREDICTION
The model training and testing took a number of tasks which involved Importation of the necessary libraries that is; numpy, pandas, matplotlib, and seaborn after installing dependencies in anaconda. Jupyter Notebook was used with Python 2. A thoroughly cleaned dataset in csv format was read. Understanding the data patterns is an Important step in data analysis [35] hence data exploration and visualization was done. To improve the performance of the classifiers, some feature engineering was undertaken. Here, domain knowledge and data mining techniques are used to extract features from raw data.
VIII. CONCLUSION
The existing research initiatives depend solely on hardware to deduct the occurrence of piped water theft. These works have basically made use of flow rate sensor data collected from water distribution and fed into the microcontroller memory to deduce the state of the network based on hardcoded rules. In this study, we have resolved the issue by integrating hardware and software approaches to intelligently predict theft. The programmed electronic circuit was used as a data collection module for the purposes of training the Random forest classifier. The data
collected over a 3 hour period in 10 seconds intervals gives a fair representation of real life scenario of piped water distribution. This data was cleaned and preprocessed which gave a total of five variables used in the study. These were; flowrate, adopted norm value, absolute difference between adopted norm and flowrate value at the instant, volume and
status of the distribution system. The data was then divided into training set and testing set which was 80% and 20% of the dataset respectively.
COMMENTS